Swing States

Swing State Teaser

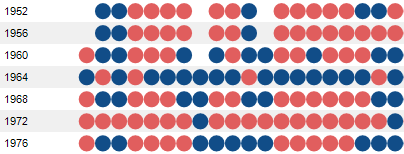
I always wondered how much those swing states actually swing. So I looked at the results of presidential elections over the last 100 years, and it’s not easy to determine which states actually are swing states from just looking at their history. Rather, there seems to be a pattern of relative stability for a few election cycles, and then big, sweeping wins for one side.

The data for this chart was collected from the U.S. National Archives and Records Administration, which unfortunately does not provide this in a very usable format. The format also switches at some point, making things more work than necessary. I had originally collected the data in a year-by-state matrix, which turned out to be a poor choice. I used Hadley Wickham’s reshape package for R to “melt” the data into a more useful format. That data was then fed to Tableau to produce this chart.

I chose a red that is quite a bit brighter than the blue to make the two colors easier to differentiate. Blue, of course, represents democrats, and red Republicans. There is also the Progressive Party of 1912 (not to be confused with the Progressive Party of 1924, but I still gave them the same color), as well as the “Dixiecrats” who only ran in 1948. They were all so short-lived that I didn’t pay a lot of attention to them, but you can find them in the chart if you look closely.

Election Results by State

You can see big, sweeping wins where one party takes over from the other, like in 1932, 1964, and 1968, etc. Bear in mind though that each dot represents a state, not a fixed fraction of either the popular or the electoral vote (which can differ quite a bit, too). I have ideas for how to show these things, but haven’t been able to do them in Tableau or Excel, and just don’t have the time right now to write a program for this.

What is also interesting to see is how recently some states (like Alaska and Hawaii) became proper parts of the US, and that even “contiguous 48” states like Arizona and New Mexico were not represented 100 years ago. The District of Columbia is the only “state” to never change color, but there are a few that have fairly consistent records, like Vermont and Massachusetts.

The goal was to make a chart that would show the progression of state winners over time. The vertical time axis is not optimal, but due to the large number of states, there really is no other choice. This layout makes it possible to see each year as one unit, and also to follow each state separately (in the large version of the image, anyway).

So this is really more a starting point than a finished visualization. I don’t think I really succeeded in showing the crucial structures here, and there is more information to be included (though I did not collect data on the number of electoral votes over time). The data is available below for you to try your hands on. Let me know what you come up with!

Data: Elections_1904-2004.zip

26 responses to “Swing States”

  1. Jon Avatar
    Jon

    Back in 2001 a classmate and I were interested in a similar question, but on the county level. The resulting discussion, maps, and animation are available at http://www.pensee.com/bowditch/maps/elections/elect_top.html
    We used data from Dave Leip’s US Election Atlas, among other sources. http://www.uselectionatlas.org/

  2. Robert Avatar
    Robert

    Robert,

    Very interesting post. I rebuilt the visualization with Microsoft Excel and made 2 minor changes:

    1. I used a horizontal time axis. In my opinion it is more intuitive to see the development over time from left to right.

    2. I added a bar chart to visualize the number of swings per state. This makes it easier to compare all states regarding the changes of color at a glance.

    If you are interested in the file, please let me know.

  3. fserb Avatar

    One thing that will probably help you in your analysis is to use the difference from the national election instead of the actual vote of each state.
    This will show you the states that have a democrat or republican bias and the ones that actually swing on their preference.

  4. Jon Peltier Avatar

    I do not think is would be too hard to transpose the chart, listing states along the left vertical axis and dates across the horizontal. I think this might make it easier to follow trends.

    Listing states alphabetically is kind of arbitrary. I wonder if some kind of ranking could be developed to rate states by some kind of regression, where states which were republican early and democratic later go to one side and vice versa. Using +1 and -1 for the parties, you could get some kind of Y= mX + b relationship, and maybe rate them by some combination of m and b. Just thinkin’, but it might help make trends easier to understand.

  5. Robert Kosara Avatar
    Robert Kosara

    Interesting! Though I actually did this specifically to not use maps. I know the Election Atlas, but I didn’t want to pay for the data, and I also found some inconsistencies in the historical data on the site (can’t remember what it was, I looked at this in the summer).

  6. Robert Kosara Avatar
    Robert Kosara

    I was actually thinking about doing a backdrop of the color of the party that won that year. Maybe if I can find some time on the weekend, I’ll work on this a bit more.

  7. Robert Kosara Avatar
    Robert Kosara

    That’s a good idea! The sad thing is that this chart is about as arbitrary as a map (with the sizes not reflecting population or votes, etc.). Even just sorting the states East-West or North-South would probably be interesting. As I said, this is really only a first step.

  8. Martin Nygaard (Denmark) Avatar
    Martin Nygaard (Denmark)

    Hello,
    – knowing that this post is out of context with the topic I would like some help with a project we are working on at my University (Aalborg University, Denmark). Eager-eyes.org has been a great help for us, with all the articles regarding visualization! It is my impression that this site is a “frontier” within visualization.
    We are currently working on a project titled “Visualizing the Unknown”. In the project we are about to make a visualization of our study, Medialogy (media and technology), which shall contain information about the substances in Medialogy – In order to provide an informative guide for future potential students. Therefore, I would like to ask if it is possible to make a video as visualization? Our ressources/skills are limited as we are 1st-year students, so videos like Radioheads “House of card” is unfortunately impossible. Can anyone help with ideas for a simple video within the subject “visualization”?
    And, do anyone know some relevant websites, which can help us out?
    Best Regards,
    Martin Nygaard
    1st-year-student at Aalborg University, Copenhagen, DK.
    mnyg08@imi.aau.dk

  9. Jorge Camoes Avatar

    Robert, this could be seen as an example of Betin’s reorderable matrix. I agree with Jon, the table must be transposed to show time left to right, and the alphabetic order should be baned from any table.

    We don’t have to have an ordering algorithm, we can reorder row by row until some pattern emerges. In any case, if you code D = 1 and R= -1 and rank by total you may have a starting point. The perfect swing state is MO (total = 0), while SD is the perfect Republican state (total=-19) and AR the (less) perfect Democrat state (total=14).

    But I have a more fundamental objection: if you are looking for the swing, you should display it, not who won. WI and OH have the largest number of swings (13 and 12) and big sweepings are clear (1932, 1964, 1968).

  10. Merle Avatar
    Merle

    At first, I had trouble with the axes selections too but, oddly, after thinking about it a bit, I think years on the left could work fine IF, as has already been said, one could come up with the right state sequence.

    In addition to Jorge’s “fundamental objection”, which I agree with if this is truly to be about swing states as defined in the provided wiki link, doesn’t it also need a “who won the election” column? Then maybe one could see the relationship between the states, whether they are a swinger or not, and their effect on the overall outcome.

    Which, for some reason makes me wonder if any viz software allows, say, the totals column to change color based on the importance/extreme/wideness of variation. Like if the swing states had a great effect on the outcome and the winner was Republican, the outcome marker would be brighter red, but duller red if not much of an effect, and all the variations in between. Hmmm… And would it make it more understandable or less so?

    Regards,

    Merle

  11. Robert Morton Avatar

    Jon, I like your suggestions. I’ve implemented a quick approximation that clusters states by the percent total votes that they gave to each candidate. Perhaps a more complete implementation would be a minimum-edit-distance approach. Here’s a thumbnail (or go here for my full post):

  12. Jon Avatar
    Jon

    Actually the maps were superfluous. We could have done the whole project in Access (or Excel) and merely used maps for displaying results.
    And we didn’t pay for the data–we manually copied it, state by state, for three of the elections. The rest was from an ICPSR dataset http://www.icpsr.umich.edu. That county-level data is harder to come by.

  13. Michael MacAskill Avatar

    Thanks for making the data downloadable. I had a play with re-ordering the states by the proportion of elections in which each went Democrat, resulting in Democrat-favouring states to the left, Republican to the right, and “swingers” in the middle:

    Larger version here.

    The more meaningful ordering allows more patterns to emerge. I think the key one is that in the past, almost the entire country swung from one side to the other, whereas since 1992 the country has been more evenly split, and some traditionally consistent states have switched sides.

  14. derek Avatar

    As Jorge says, Bertin’s reorderable matrix concept is intended for manual tuning, but I’m lazy and won’t spend the time necessary to get familiar with the subject data. So I sorted in order of “centre-of-gravity”, according to whether the state had started Republican and trended Democrat, or vice versa, and in what years. The result was this table (I hope this works and doesn’t break anyone’s browser, apologies if it does):

    click for larger image

    This seems to show a switch-round of states around 1964 or 1968, blue states going red and red blue. I’ve heard of this switch before, which is said to date from Johnson’s win in 1964, when he took most states, but the Republican, Goldwater, took a few formerly blue states that remain red to the present day. It’s apparently quite striking on historical maps at 270towin.com.

    My crude auto-ordering needs to be manually tidied up by a historian or geographer to illuminate the trends more intelligently. Perhaps the states could be lumped into categories, then auto-sorted within each category?

    BTW, I don’t have any problem with reading down for time; it’s a normal direction for tables, if not for graphs, and it avoids choosing which party to put on “top”.

  15. Enrico Bertini Avatar

    Hi Robert, only now I realized how many ideas have been collected already here on the topic.

    In the meantime I have designed a little java application to visualize the data. Here is a screenshot.


    click for larger image

    I have presented, as suggested by someone above, only the swings from one party to another. I have also used the x-axis for time and the y-axis for states.

    The application has some interactive widgets that permit to isolate the states with a certain number of swings. It also permits to isolate specific swings (e.g., from democrat to republican).

    I am planning to turn it into an applet soon and make it available in my Visuale. Unfortunately I have no experience with applets :-( But I think it will be fast and simple (I hope!).

    Enrico.

  16. Merle Avatar
    Merle

    So, I was thinking along the same lines as derek when I posted last night, but didn’t get much done with it.

    I thought, “what difference does it make what order the years are in either, for that matter.” Would it tell a better picture if they were totaled both by state and by year and then sorted from Democrats in the upper left corner to Republicans in the lower right? From the image, then, you could see where the anomalies were and then reference the year and state.

    (Apologies for the horizontal lines, which should not be there. Had some trouble figuring out how to get an image out of an OpenOffice spreadsheet.)

    Merle

  17. derek Avatar

    This time I sorted hierarchically, starting with the most recent election and working back. So on the left are the states that have gone the longest since going to the R candidate, and on the right are those which have gone the longest since going for the D:

    click for larger image

    Interesting result on the right hand side there for *that* 1964 election. Everybody talks about Goldwater flipping the “solid South”, but not so many people mention the 11 states that went for Johnson and have never gone for the Democrat since. I wonder if any of those will change this week?

  18. Pedro Monteiro Avatar

    One of the first things I though was that there is no better ‘code’ than words and I wanted to use the states names to do this visualization. Since there are same small names and some very large ones I choose to use the letters used in the abbreviations of the states names. I think that since I’m not American I needed to still have the states full name.

    By having the states named with two letters the data can be read by ‘cutting’ the 100 years in half and I enjoyed that and some of the data really works like that in some states (there are some really impressive changes from the tendencies of the first half of the century and the second half).

    On the other hand, one can look to both letters and have a quick feeling on the color that the state ‘is’. Another set of data that could be of interest is the percentage of the times that each state got the president they had chosen. Maybe I will look at this when I have a little more time.

    I hope you enjoy this. If you want to comment this (and I would really like it), please visit my blog http://whatype.files.wordpress.com

  19. Robert Kosara Avatar
    Robert Kosara

    Looks like I need to post more bad visualizations – these are great responses! I will have to digest them a bit and then I’ll put together a summary of what I’ve seen and what I think.

  20. derek Avatar

    Even a crude division into “West”, “South” and “East” states brings more pattern into view. The ordering within areas is the same centre-of-gravity heuristic as in my first version.
    click for larger image
    Obviously other sortings within or between the three areas are possible, for instance WV, KY, TN and MO seem to make a group, as do HI, CA, OR and WA (but what about Alaska?)

  21. Enrico Bertini Avatar

    Hi Robert,

    Just a quick update to let you know I have finally posted online my applet on the swing states. You can find it here: http://diuf.unifr.ch/people/bertinie/visuale/.

    Best,

    Enrico.

  22. Anonymous Avatar
    Anonymous

    This does nothing to help the colorblind.  I cant see the difference between the dots on the images at the top.  Its useless to me.

  23. Robert Kosara Avatar
    Robert Kosara

    That’s interesting input, thanks! What about the NY Times election map? Those colors are closer in luminance than mine, imho – can you distinguish those? I’m working on a further version of this, and will make the colors easier to differentiate in the future.

  24. Matthew D Healy Avatar
    Matthew D Healy

    Here is my version, done entirely within Excel.  Aside from adding the 2008 results, for my sort order I chose a weighted count of “D” since 1980 where 2008 has a weight of 1.0, 2004 has a weight of 0.8, 2000 has a weight of 0.64, and so forth, in order to rank states according to both how frequently they voted one or the other way, and how recently:

    http://mdhealy.home.sprynet.com/Elections_1904_2008.png

    One thing I like about my sort order is how it highlights States that have gone against their trend in recent elections.

  25. Matthew D Healy Avatar
    Matthew D Healy

    The book Red State Blue State Rich State Poor State by Andrew Gelman has many interesting visualizations of statistical data about US voting by State.  Perhaps the most important and interesting point made in the book is that two main patterns dominate the overall picture: States where the median income is high tend to vote Democratic while individuals whose income is high tend to vote Republican, because voting tends to be determined by a balance of cultural and economic influences.  Rich States tend to have cultural factors favoring Democrats, while rich individuals tend to have economic interests favoring Republicans.


  26. Matthew D Healy Avatar
    Matthew D Healy

    That’s one reason why my version includes the party letters.  Also I dislike having to refer to a key so when possible I try to make my graphics self-explanatory without any key.