EuroVis raged on through the end of the week with talks, posters, and lots of food. This second part covers papers about visualization evaluation, high-dimensional structures, graph layouts, etc., as well as the capstone and closing (with information about next year).
Papers: Visualization Design
Exploring the Visualization Design Space with Repertory Grids by Kuno Kurzhals and Daniel Weiskopf describes an interesting way of conducting semi-structured interviews to get to people's ideas about visualizations (or anything, really). The technique is pretty simple but effective: You look for things that go together and things that are different, and assign terms to them (like ugly-beautiful, simple-complex, etc.). You end up with a matrix of which element belongs where on each of those axes. The project page I'm linking to has an interactive version of their tool online to play with. This paper also received a Best Paper Honorable Mention.
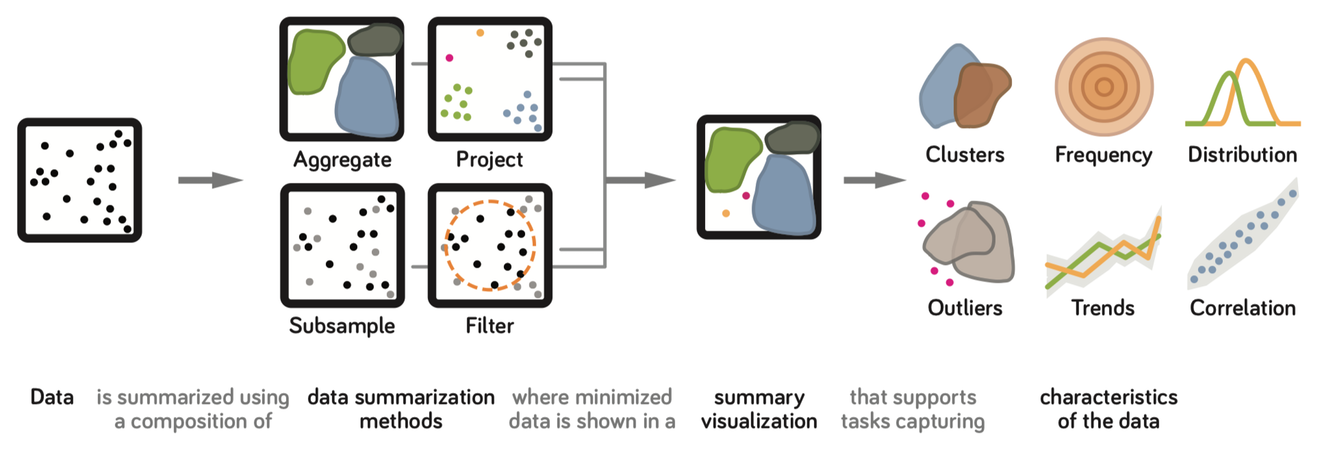
Design Factors for Summary Visualization in Visual Analytics by Alper Sarikaya, Michael Gleicher, and Danielle Albers Szafir uses a much more bottom-up approach that requires pre-defining terms (unlike the one used in the previous paper), following a technique called Quantitative Content Analysis that is popular in cartography. Their classification of visualizations is available on their project page as well.

Assessing Effects of Task and Data Distribution on the Effectiveness of Visual Encodings by Younghoon Kim and Jeffrey Heer is one of those well, duh! papers, but that makes it important. They looked at a number of configurations of visualizations and varied the task and complexity of the data. They find that there isn't just a simple answer to "what visualization is best given this structure of data," but that it depends on the actual task (especially whether that is a summary or detail task), but also how much data there is and how much it crowds together. Depending on their criteria, they find a pretty clear ranking of techniques, which is actually surprising to me, that nicely extends the work we all know from the 1980s (Mackinlay's APT in particular).
The Perception of Graph Properties in Graph Layouts by Utkarsh Soni, Yafeng Lu, Brett Hansen, Helen Purchase, Stephen Kobourov, and Ross Maciejewski – I did not see this presentation, but the paper looks very interesting, so I'm including it here for folks who might find it interesting.
Papers: Structure, Embeddings
Hypersliceplorer: Interactive visualization of shapes in multiple dimensions by Thomas Torsney-Weir; Torsten Moeller, Michael Sedlmair, and Mike Kirby is a pretty mind-bending way of looking at high-dimensional polygons. It's based on the Hyperslice idea from 1993, but adds slicing of the high-dimensional object and shows different projections in a matrix. The user can pick which slice from each of the views to highlight in the other views. It's still way over my head, but it's quite interesting to look at.
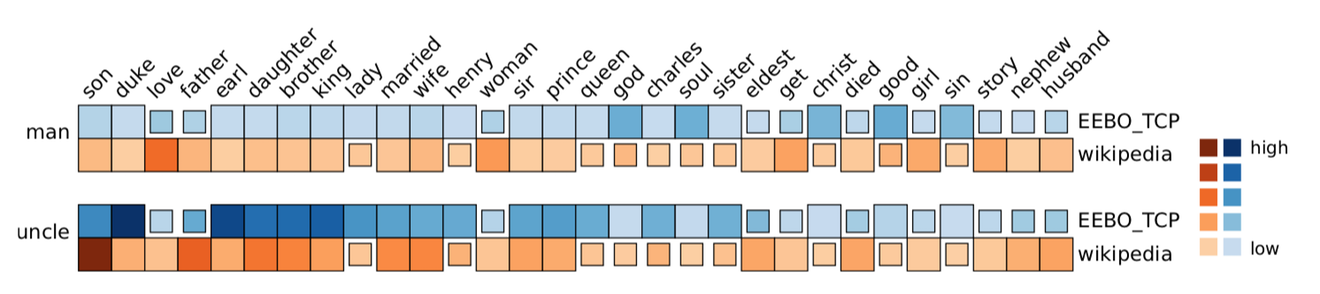
Interactive Analysis of Word Vector Embeddings by Florian Heimerl and Michael Gleicher looks at what people do with vector embeddings like word2vec and then designed some ways of achieving some of the less common ones (like tracing them over time, comparing between corpora, etc.). The project page has some more information and an interactive demo.
Short Papers: Design and Evaluation
**VisGuides: A Forum **for Discussing Visualization Guidelines by Alexandra Diehl, Alfie Abdul-Rahman, Mennatallah El-Assady, Benjamin Bach, Daniel Keim, Min Chen describes their online forum, VisGuides, for discussing guidelines for visualization. I will have some more to say about this, but in short I think it's a good idea and should be supported by the community. The only way to have impact is to be present online, and VisGuides is as researcher-focused and specific to visualization questions as it gets.
Sketching Temporal Uncertainty - An Exploratory User Study by Fabian Schwarzinger, Andreas Roschal, Theresia Gschwandtner describes a study where they had people sketch ways of showing data about temporal uncertainty (like project planning, bus arrival times, etc.). The twist here that this was not based on data, but rather on scenarios. They got some interesting designs, unfortunately the paper doesn't appear to be available online, though.
I'm also throwing in a poster here that I liked: An Eye-Tracking Study on Sparklines within Textual Context by P. Ruchikachorn and P. Rattanawicha. It's a somewhat preliminary study, but they tested sparklines the way they're actually meant to be used (as part of text) and compared how Thai users would read English or Thai text with sparklines differently. They found that they spent more times looking at the sparklines in English text, which is kind of interesting. They also have their study materials and more detailed results available at the link.
Sets and Graphs

SetCoLa: High-Level Constraints for Graph Layout by Jane Hoffswell, Alan Borning, and Jeffrey Heer describes a domain-specific language for customized graph layouts for social networks, etc. The idea is to define sets of nodes based on attributes, then define constraints on them (especially for hierarchy). A number of different constraints and layouts are possible (like trees, circles, etc.). In typical UW IDL fashion, the source code is available and there's even an online playground where you can try out some of the provided examples or build your own graphs right in the browser.
Multiscale Visualization and Exploration of Large Bipartite Graphs by Nicola Pezzotti, Jean-Daniel Fekete, Thomas Höllt, Boudewijn P.F. Lelieveldt, Elmar Eisemann, Anna Vilanova may not reveal it in the title, but it's actually about finding filter bubbles in social networks. The authors take a very interesting approach to analyzing who follows whom and finding the little echo chambers that way. This is more difficult than it sounds because of the size of the networks. The source code for this project is also available.
Capstone: Daniel Sýkora
Sýkora works in an area called style transfer, which allows you to transfer the style of a painting or drawing to a new image (the image is not his, I got it from this Medium post). This has been done for a while now, but many approaches are sort of shallow and don't create very compelling images (that have light and shadow in the right spots, etc.). Sýkora's talk went into excruciating levels of detail on how to do this right, but his examples were quite fascinating. It's also interesting to see how artists are both interested in this work for training (to learn shading, etc.) but also worried that they might irrelevant.
Next year's conference will take place in Porto, Portugal, June 3–7 2019.
So Much Food!
This was the 20th EuroVis (though it started life as VisSym and only became EuroVis in 2006 or so). It also set new standards for food and social events. There was ample and excellent food throughout: breakfast, breaks, lunch, breaks, several receptions, and the conference dinner. It was actually to the point where it was almost too much: having piles of cake etc., available in all the breaks is not the best thing when you're sitting most of the day. I can't really complain about having a cook shucking oysters at the conference dinner, though…
This year's conference also set new standards for associated events. The highlight clearly was the showing of a short movie about Gregor Mendel (who discovered the rules of inheritance of traits and basically started the field of genetics) projected onto the wall of the monastery where he had grown his peas to study the colors of their buds and shapes of the seeds. This had been created by Drew Berry (the keynote speaker) for an event in 2015, and they basically repeated it for us. It's going to be pretty tough to top that kind of historical significance and perfect visualization tie-in in the future.