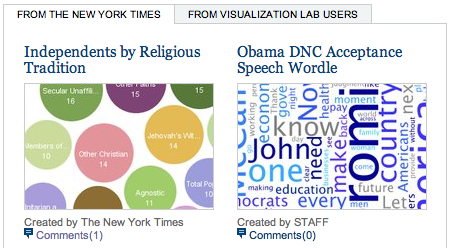
The New York Times Visualization Lab
The New York Times' new Visualization Lab uses IBM's Many Eyes technology. While it provides easy access to a wealth of visualization techniques and the possibility to comment, there is one major difference: only data provided by the NY Times can be used. The kind and quality of that data will determine the success of this new site.
I criticized Many Eyes for not having a business model, but figured that they would be able to survive within an organization as large as IBM. Looks like they had a strategy, after all. Martin Wattenberg has also worked with the NY Times (he had a paper at this year's InfoVis conference), and he has an interest in InfoVis for the Masses.
The big difference between Many Eyes and the NY Times VizLab is that users cannot upload their own data. That means that the offered data will be crucial for the success of this site – if it's not interesting, people won't bother going there. And if the data is coming from online sources (and easy to obtain, like the data that is there right now), there will be little difference between the NY Times site and Many Eyes itself.
But that is where the New York Times can offer a huge value-add: by supplying data that cannot be easily found on the web, but that is collected by (or on behalf of) the NY Times. I'm specifically thinking of data like exit poll results, where usually only a small number of cross-sections are published. It would be excellent to have such data available to find some interesting comparisons of voters based on a number of criteria.
The NY Times name will certainly drive traffic, but to make the site compelling and make people come back, an investment in good data will be needed.
Posted by Robert Kosara on October 28, 2008.

