Vis Potpourri, October 2017
A potpourri isn't usually structured, since it's supposed to be thrown together and mixed. But this one has a section on reports from this year's VIS conference, plus various miscellaneous items like a tool to explore a brain atlas, some history on spreadsheets, and a celebration of Archer, among other things.
VIS Reports
A traditional blog post is by no means the only way to share a conference report: Matt Brehmer made a lively 'Highlights from IEEE VIS 2017'-story on Storify to share his personal highlights and takeaways by integrating tweets. It's great to see more conference reports that paint a broader picture of the event both for attendees and those that could not make it to VIS.
In addition to her SciVis perspective on VIS here, Noeska has written up some more thoughts on the VIS conference. She talks about tutorials, the blogging meetup we ran together (I being Robert), and a few more things.
Ming Yao wrote up yet another perspective on VIS, in his conference report focusing mainly on Machine Learning-related events and talks (most of which Robert missed).
Other Potpourri Items
Earlier this year, Elijah Meeks ran a survey asking people who do visualization about their thoughts on their working the field. Shirley Wu has now analyzed that data in more depth, and put together a visual exploration of data vis frustrations.
RJ Andrews has turned his static "scroll" poster of historic data visualizations into an interactive history timeline you can explore. Each entry has an image and some background information. And this poster goes well beyond the usual Minard, etc. examples. RJ has also written up his process and some thoughts.
Brainscope, an online tool for interactive visual exploration of the spatial and temporal brain transcriptome using t-SNE, based on data from the Allen Human Brain Atlas, was released this year. This tool, aimed at molecular neuroscientists, provides a dual t-SNE methodology to explore high-dimensional data (genes and samples from the brain) directly in the browser.
We just passed Spreadsheet Day, celebrating an under-appreciated but incredibly powerful technology. It's worth reading an article from 1984 by Steven Levy about early spreadsheets and the impact they were having. Also, this short and very readable paper by Alan Kay on software uses spreadsheets to argue for the power of flexible computing that lets users interact directly with their data.
Bob Laramee, one of the panelists on this year's 'Best Panel' at VIS, was recently interviewed by the CHERISH-DE Centre at Swansea University and shares his thoughts on data visualization and industry collaborations.
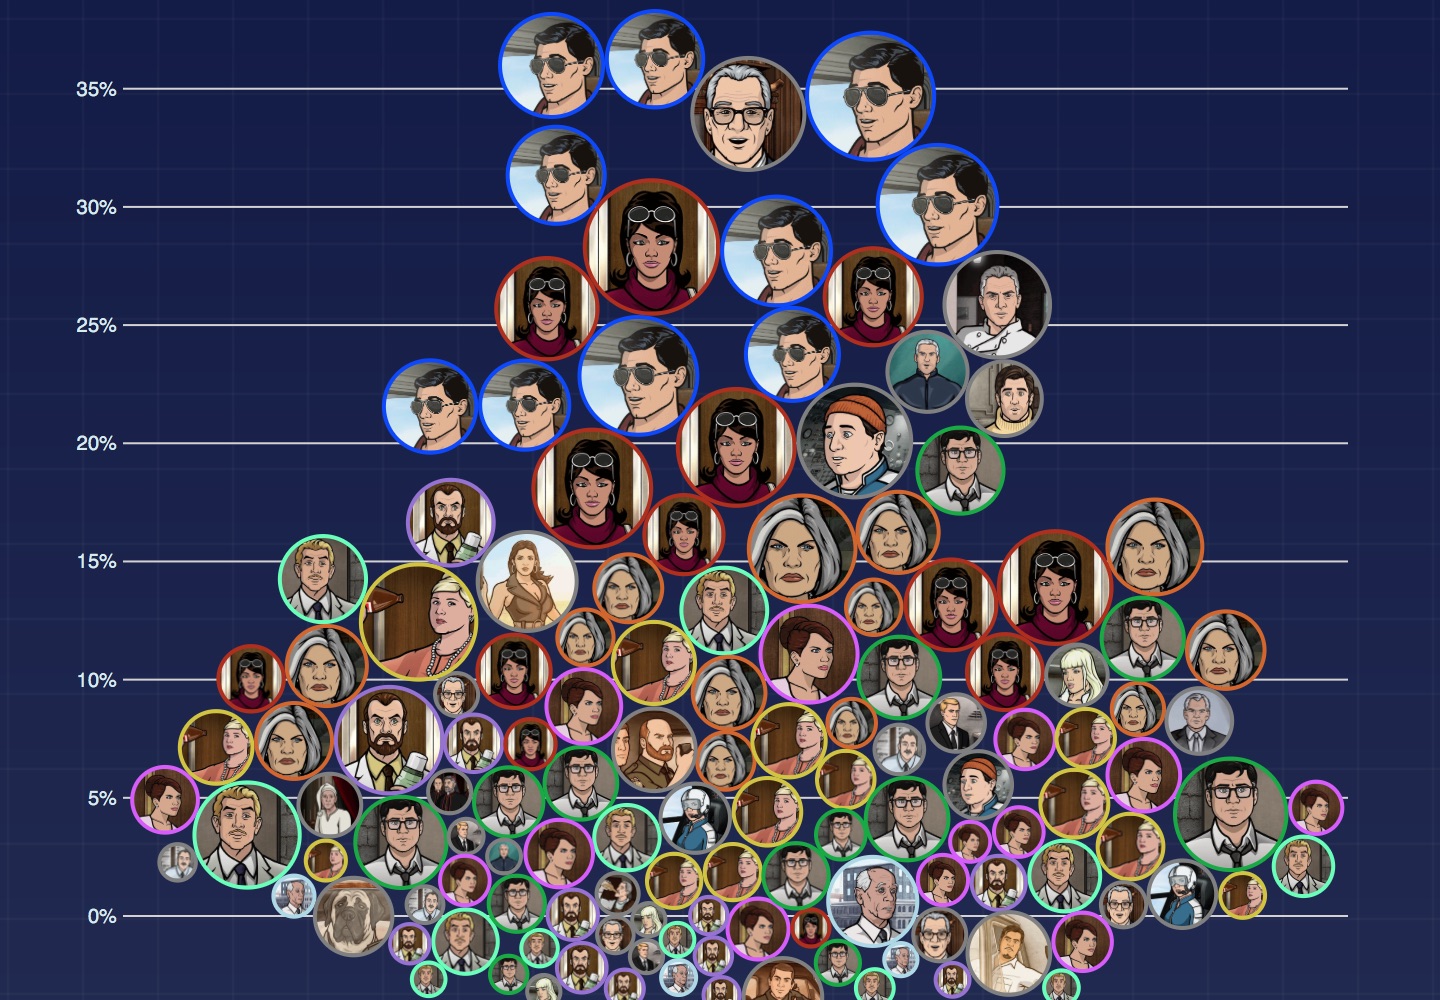
If you're a fan of the tv series Archer, head over to the aptly titled Beyond the Tip by Mara Averick and Elija Meeks. You can explore all the seasons, look at the interactions between the different characters, etc. Though try as you might, you will never be able to match Mara's Archer-themed animated GIF game on Twitter.
Vis Potpourri is a monthly series, put together in collaboration with Noeska Smit.
Posted by Robert Kosara on October 25, 2017. Filed under vis-potpourri.

