What is a visualization? The word is problematic, and there have been very few definitions that try to define this field we are working in. More importantly: what is not a visualization? It is easy to argue that anything visual is a visualization in some way – but does that mean anything? Here is a definition of visualization and a few examples to illustrate the different criteria.
Definition
The following are three minimal criteria that any visualization has to fulfill to be considered a pragmatic visualization. A good visualization certainly has to do more, but these criteria are useful to draw the line between a lot of things that are often called visualization and what we consider visualization in this field.
- Based on (non-visual) data. A visualization's purpose is the communication of data. That means that the data must come from something that is abstract or at least not immediately visible (like the inside of the human body). This rules out photography and image processing. Visualization transforms from the invisible to the visible.
- Produce an image. It may seem obvious that a visualization has to produce an image, but that is not always so clear. Also, the visual must be the primary means of communication, other modalities can only provide additional information. If the image is only a small part of the process, it is not visualization.
- The result must be readable and recognizable. The most important criteria is that the visualization must provide a way to learn something about the data. Any transformation of non-trivial data into an image will leave out information, but there must be at least some relevant aspects of the data that can be read. The visualization must also be recognizable as one and not pretend to be something else (see the discussion of Informative Art).
This definition was published in a paper on Visualization Criticism, part of which I discussed in an earlier posting.
Examples
The following examples show how these criteria provide a clear separation of visualization (in the sense of scientific and information visualization) and other kinds of data transformations that result in images.

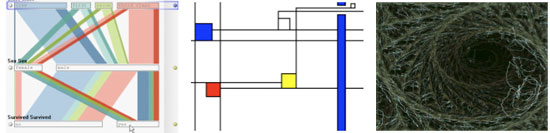
MilkDrop is one of the most impressive music visualizers. Not only does it have a huge range of different styles that it can transition between, it's also very good at detecting beats and different instruments, so the visualization really fits the music. Since it creates images from wave data, it clearly fulfills the first two criteria. But what about readability? Can you tell which song was played when the image above was created? This is not a shortcoming, it's simply not the goal of a music visualization to be readable (and it would be very difficult). But music visualization plugins are not visualizations in the pragmatic/information visualization sense.
VisualIDs are a very clever idea to help the user tell files apart: they produce images from the names of files to produce visually similar (but still distinct) icons for files with similar names. Since they are based on data and are visual, they could be a visualization. But they also fail the readability test, you cannot tell which image represents which filename. A poetry visualization I discussed earlier has the same properties.
Radiohead's recent video for their song House of Cards was "shot without cameras," using LIDAR and structured light real-time 3D imaging devices. This has been described as "using visualization," but I disagree. The data that is being rendered was acquired using visible light, and so doesn't show anything that would not be visible through the naked eye. In fact, to make the video watchable for a general audience, they had to use something that produced a fairly realistic image. So the first criterion is clearly not fulfilled. I also have to say that the result does not strike me as particularly interesting – it's a bad sign when the making-of is much more interesting to watch than the video itself.
Conclusion
The many meanings of the term visualization can cause confusion and loss of focus. We need to know what we are talking about when we are working in scientific or information visualization. The definition given above provides a baseline that all visualizations must fulfill to be considered part of this field. More work is clearly needed.
Comments (13)
Posting new comments was disabled in 2020.