Venn diagrams are a great way to visualize the structure of set relationships. They're also an example of a technique that works very well for a particular purpose, but that entirely fails outside its well-defined scope or when the number of sets gets too large.
The idea of the Venn diagram is simple: sets are shown as regions, typically circles. The inside of the circle represents elements of a particular set, the outside anything that is not in that set. A set might contain all dogs: anything inside the circle is a dog, anything outside is not a dog.
It gets more interesting when more sets are involved. The typical schoolbook example is of two sets and their potential interactions. Let’s say the left set in these images contains dogs, the right one black animals.

The left image shows set intersection: all A that are also B, i.e., all dogs that are also black. The right image shows set union: all things that are in at least one of the sets, i.e., all dogs and all black animals (including black dogs). Even without being familiar with set theory, it’s still easy to understand where the criteria overlap and where they don’t.

Slightly more complex relationships are set difference and set complement. The left image shows A subtracted from B, i.e., black animals that are not dogs. The right image includes all elements that are in either A or B (but not both), i.e., dogs or black animals, but not black dogs.
There are more set operations, and they are all easily explained using Venn diagrams. I imagine that many people think of Venn diagrams when they think of sets. That is not a bad thing as long as the limitations of the technique are understood. Many typical set problems are simple enough to be solved using Venn diagrams.
Limitation: Number of Sets
While Venn diagrams are great for two or even three sets, they very quickly break down when the number of sets goes beyond three. It’s not like people haven’t tried, though, with results ranging from pointless to downright silly.
Four sets are doable, though they show the challenge as more sets are added. The shapes of the intersections are very different, and it becomes easier to miss configurations. The simplicity and regular layout that made the two- and three-set diagram useful is nowhere to be found.

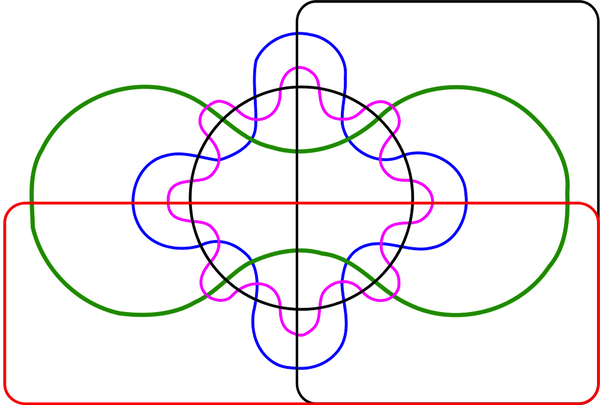
The image below shows a version of the Venn diagram for six sets. Not only are most people unable to think in terms of all the 64 possible combinations of six sets, the diagram does not provide much help.
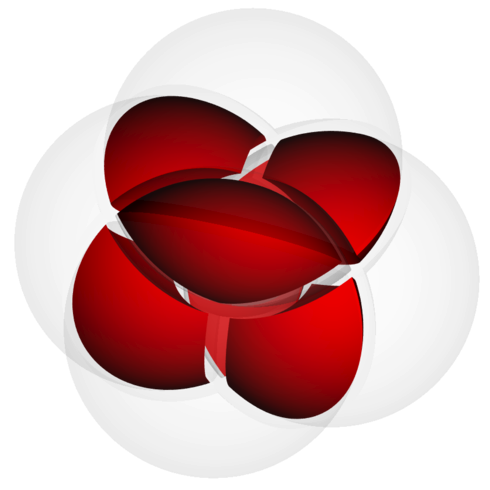
If it’s not possible in 2D, then maybe in three dimensions? This image is supposed to show some of the possible intersections of four sets. While it’s nice to look at, it should be obvious that it is futile to figure out which sets are included and which ones are not.
All visualization techniques break down at some point. In most cases, it is fairly obvious when it happens, but there is no hard number that clearly defines that point. There are also many criteria like screen resolution, etc., that have an impact. But in the case of Venn diagrams, that point is very clearly defined: two or three sets work perfectly well, anything above three sets is pointless.
Limitation: Sizes of Sets
Another piece of information Venn diagrams do not convey is the size of a set. While it is possible to imagine doing that, it typically does not work without serious distortions of the diagram. If the shape has to be altered significantly to correctly represent size, it is likely that different parts of the diagram will be very different shapes, thus being tough to compare. The Venn diagram simply isn’t able to perform this function in a reasonable way.
In the medical and bioinformatics literature, Venn diagrams are a popular way of showing different study conditions, sometimes with the intention of directly reflecting set sizes, sometimes with annotations. Rather than insist on Venn diagrams, it would be a better idea to use better alternatives, like I have shown in the past.
Conclusions: Venn to Use, Venn Not to Use
Venn diagrams have their uses. They’re great for teaching basic set theory and they can help illustrate combinations of criteria, as long as there are no more than three. But it is equally important to be aware of the limitations, and to know when to look for alternatives.
All images from the Wikipedia page on Venn diagrams.
Comments (17)
Posting new comments was disabled in 2020.