Parallel coordinates are a very popular visualization technique for multi-dimensional numerical data. In this paper, we propose a set of metrics to better understand the types of visual structures users commonly look for using this technique. Based on the metrics, we can optimize the display to make it more readable, and allow the user to select dimensions based on their visual structures, rather than their existing ideas about the data.
Metrics
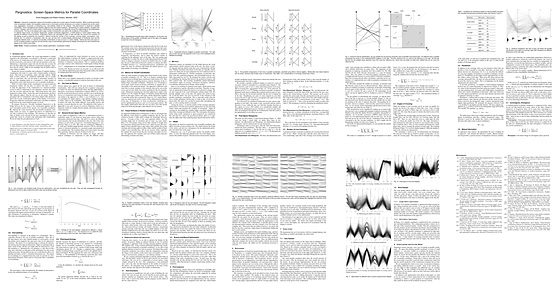
The metrics are motivated by the kinds of structures that are typically considered indicators of certain patterns in the data: lots of crossing lines indicate inverse correlations, triangular shapes point to categorical (or otherwise non-continuous) data, etc.
We consider parallel coordinates not so much as line sequences across all dimensions, but as a sequence of axis pairs. After all, tracking single lines from one pair of axes to another is usually difficult, and we mostly look for the patterns between pairs of axes separately to understand the data. This view not only makes it easier to define these metrics, it also greatly increases the efficiency of the optimization process.
Metrics include the number of line crossings, the angle between lines that cross (right angles make it easier to tell which line is going where than small angles), parallelism, overplotting of lines, convergence and divergence of lines, mutual information, and pixel-based entropy.
The term pargnostics stands for parallel coordinates diagnostics, similar to scagnostics for scatterplots. Like scagnostics, our metrics are not independent, and we have no way of knowing whether our set of metrics is complete; but we believe these to be a minimal set for many useful tasks.
Optimization
Once we can measure, we can optimize. Rearranging axes based on a single metric or a weighted combination makes it possible to get particular views, like many crossing lines, higher crossing angles, etc. Considering axis pairs as independent makes this theoretically very expensive (NP-complete) operation very efficient.
This is even true if we consider axis inversions. This is a local property in our model, which applies only to the current axis pair. This way, we can include axis inversions at virtually no cost.
We also propose two new views: a parallel coordinates matrix that is similar to the common scatterplot matrix, and a view that lets users sort axis pairs by any of the metrics. Both views let the user put together a parallel coordinates plot by selecting axis pairs they find visually interesting.
Aritra Dasgupta, Robert Kosara, Pargnostics: Screen-Space Metrics for Parallel Coordinates, Transactions on Visualization and Computer Graphics (Proceedings InfoVis), 2010.
The paper will be presented at VisWeek 2010 in the second morning session on Thursday, Multi-dimensional Visualization.