After a very successful Tapestry conference in February this year, we have been getting a steady stream of questions from people about another event next year. Now we're finally able to announce next year's event. And it will be awesome, again.
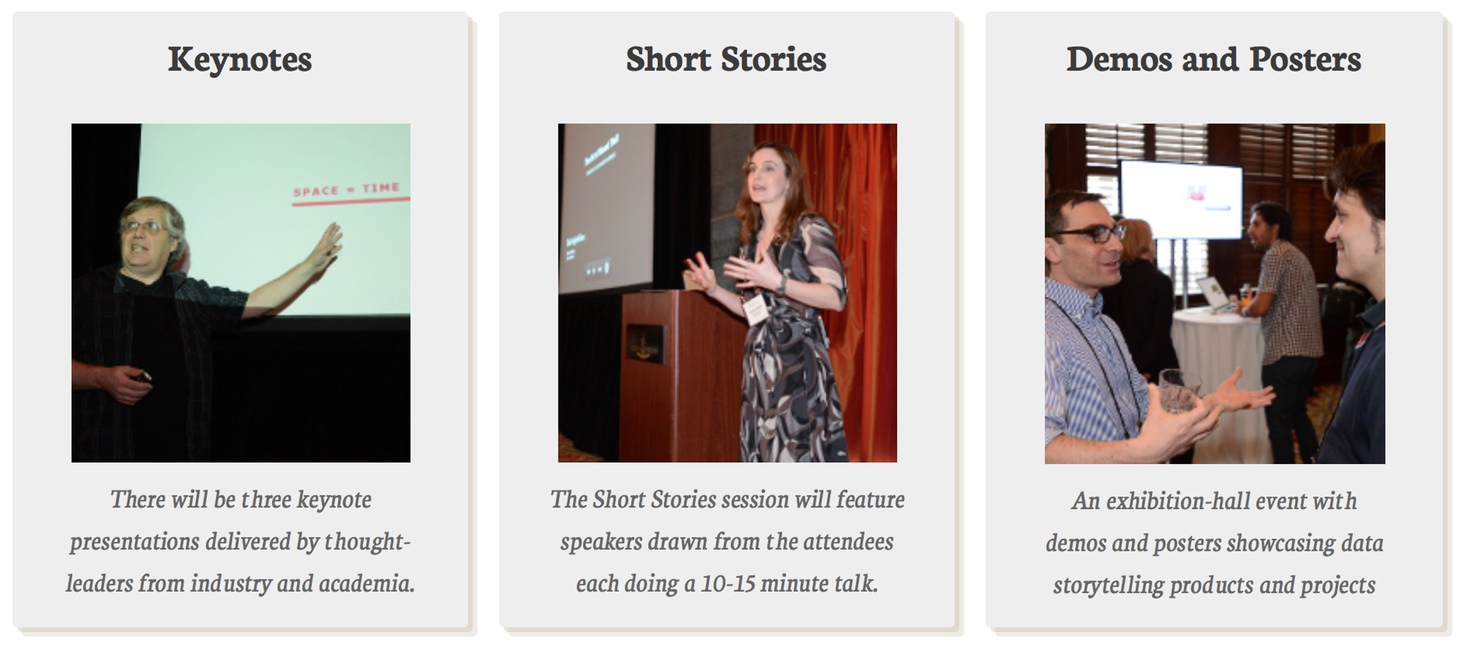
There's no point in listing all the information here, since I also wrote the announcement posting on the Tapestry blog. But we have another great line-up for keynotes and short stories, there will be a demos session, and we will also have posters.
Tapestry 2014 will take place on February 26, 2014, in Annapolis, Maryland. If you're interested in attending, request an invitation. We will again be limited to about 100 attendees, so don't wait too long!