The IEEE VIS 2017 conference took place last week in Phoenix, AZ. I’m slower to write about it than in previous years, but to make up for that I’m not going in chronological order this time, but will break this report up in a more logical manner. This first part covers the opening, which included presentations of the best papers from all three tracks plus a new Test of Time award category.
Technical Awards, Test of Time Awards
Awards can be a bit tedious, but they’re also important. VIS has moved all the boring service awards out of the opening session, which is a good thing (yes, they're well earned, but they're also boring). They still hand out technical awards in the opening though, which this year went to Chuck Hansen (Career Award) and Jeff Heer (Technical Achievement Award).
There were also the Test of Time Awards for papers that were published a while ago but are still influential today (they had those last year as well, but they were much less prominent). I think that’s a great idea, and these awards will hopefully help people see beyond their often limited time horizon a bit.
I’m listing the papers here without any explanation, but I will write about them in future postings.
- SciVis: Visualization of Second Order Tensor Fields and Matrix Data by Thierry Delmarcelle and Lambertus Hesselink (1992, 25 years), and Efficient Computation of the Topology of Level Sets by Valerio Pascucci and Kree Cole-McLaughlin (2002, 15 years)
- InfoVis: The Structure of the Information Visualization Design Space by Stuart K. Card and Jock D. Mackinlay (1997, 20 years), and ManyEyes: a Site for Visualization at Internet Scale by Fernanda B. Viégas, Martin Wattenberg, Frank van Ham, Jesse Kriss, and Matt McKeon (2007, 10 years)
- VAST: Jigsaw: Supporting Investigative Analysis through Interactive Visualization by John T. Stasko, Carsten Görg, Zicheng Liu, and Kanyupriya Singhal (2007, 10 years)
I also got curious during these presentations about how long ago the Marching Cubes paper had been published, and turns out it’s 30 years old this year (published in SIGGRAPH, since there was no Vis conference in 1987)! This will be the subject of a posting soon, as well.
Best Papers across VAST, InfoVis, and SciVis
Another new thing in the opening was the presentation of the best papers across all three tracks. This way, everybody gets to see at least one paper from a track they don’t usually go to. I think that’s a great idea, and it worked well.

Visualizing Dataflow Graphs of Deep Learning Models in TensorFlow by Kanit Wongsuphasawat, Daniel Smilkov, James Wexler, Jimbo Wilson, Dandelion Mané, Doug Fritz, Dilip Krishnan, Fernanda B. Viégas, and Martin Wattenberg received the Best Paper award in VAST. They describe a system called TensorBoard to help engineers develop and debug deep learning networks. To do this, they have to transform the low-level data flow graph a into high-level interactive graph by combining nodes into modules, so that the overall structure can be understood. Users can then expand and collapse these modules as necessary. The system’s source code is available.

Modeling Color Difference for Visualization Design by Danielle Albers Szafir, the Best Paper in InfoVis, is also notable for being a single-author paper. Danielle ran a large number of studies to test whether the common assumptions built into the CIE LAB color space hold in visualization, where marks can be small (like in a scatterplot) or long but thin (like lines in a line chart), and they don’t appear in isolation. Visual complexity in particular leads to lower discriminability of colors than even some more recent (more conservative) color perception models predict. Bar width and length also impact color discriminability, etc. There are a lot of results in her paper and the webpage I’m linking above also has additional materials.
It’s also interesting to note here that the best paper award and the honorable mentions in InfoVis this year all went to papers written entirely by women.
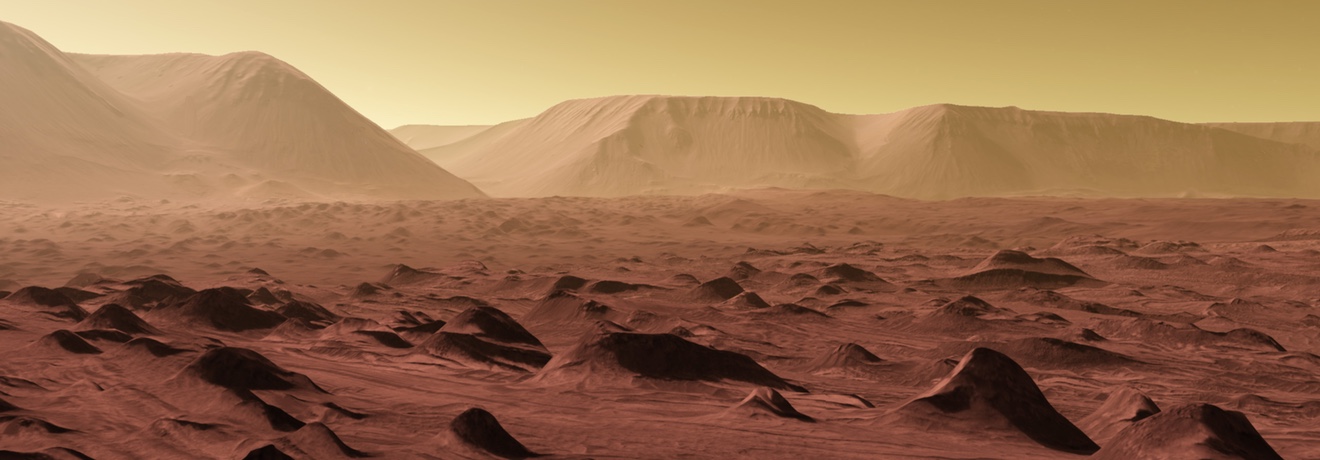
Globe Browsing: Contextualized Spatio-Temporal Planetary Surface Visualization by Karl Bladin, Emil Axelsson, Erik Broberg, Carter Emmart, Patric Ljung, Alexander Bock, and Anders Ynnerman was the best paper in SciVis. They described their work on Open Space, a system to explore and show data about the solar system, from low-altitude fly-overs of Earth and Mars, to views of the entire system. They integrate real-time data from a variety of sources, like satellite data for weather patterns on Earth, high-resolution imagery of Mars, etc.
Unfortunately, the talk didn’t make it very clear what was new here – especially after Anders Ynnerman’s impressive keynote at EuroVis last year. So I asked how what they were doing was different from Google Earth. I’m sure that led to some eye rolling, but it helped me understand why this was chosen as the best paper (and several people told me later that they had had the same thought, so it wasn’t just my ignorance). In short, their system deals with a lot more data, has access to a much larger range of different kinds of data, and is used by scientists as well as educators in planetariums.
This is a good lesson for future Best Paper presenters at VIS, though: when you’re speaking in front of an audience that includes many people outside your field, you have to make sure you say some seemingly obvious things explicitly and point out what is new and different about your work.
VIS in the Coming Years
Since this was mentioned in the opening session, I’m including the plan for the next few years here as well. This is not a secret, there’s now a page on the IEEE VIS website with future locations and dates.
- 2018: Berlin (Germany), October 21–26
- 2019: Vancouver (Canada), October 20–25 (dates tentative)
- 2020: Salt Lake City, UT (tentative)
It’s notable that VIS will be outside the U.S. for two years in a row. It’s not that long ago that even holding it outside the U.S. at all was considered impossible – Paris in 2014 proved that wrong.
What concerns me a little is the statement in the opening session about there being “over 1000 attendees” at the conference. That number has been flat for three years, and it’s lower than Paris. It’s a bit early for growth to level off like that, in my humble opinion.
See also:
- Keynote and Capstone
- Word Clouds, Stories, Interaction
- Perception, Evaluation, Vision Science
- Machine Learning, Diversity, Parties