More Things To Do at VIS: BELIV, VisLies, Social Media Meetup, Etc.
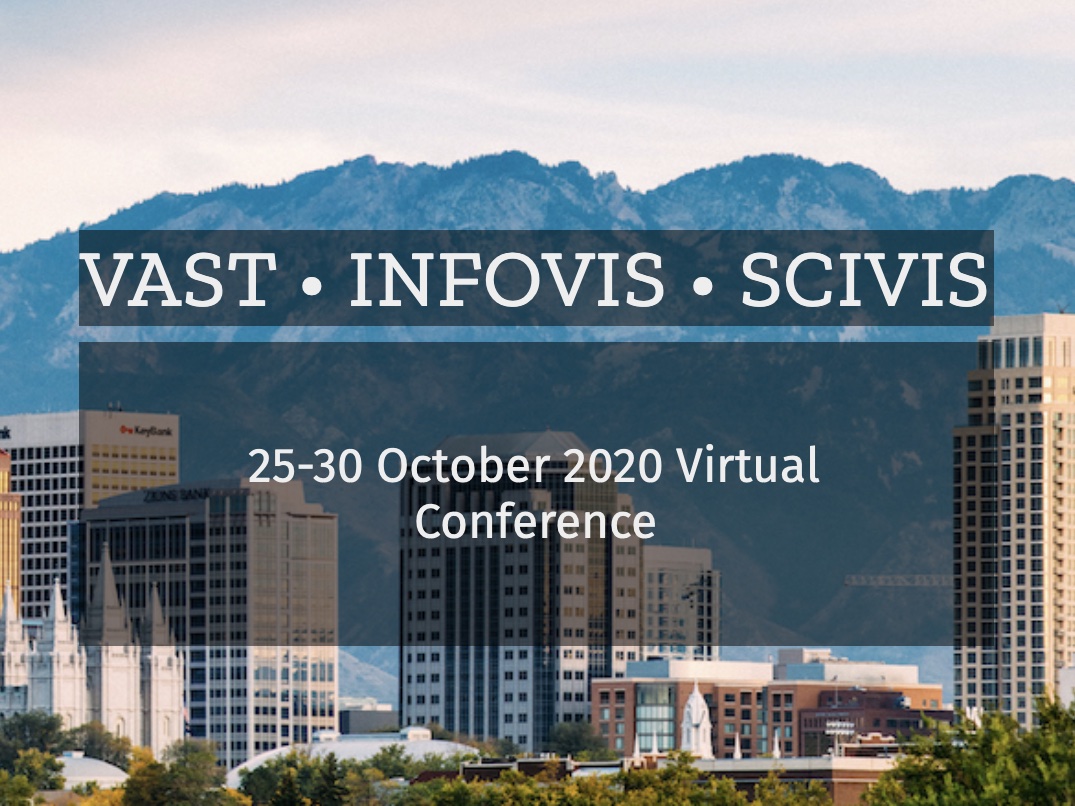
For next week's IEEE VIS conference, here are some more pointers to things that I think are worth checking out in addition to my previous list. This includes a few of the major events as well as some meetups you might otherwise have missed.