Sightings: A Vennerable Challenge
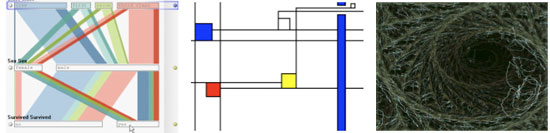
Venn diagrams are a strange mix of structure and data visualization. In my latest Sightings column (PDF) for American Scientist, I use the example of a visualization challenge from last year to discuss different ways to show the same data about diagnosis techniques for autism in young children. This also sparked the launch of a new site feature: Ask Eagereyes.