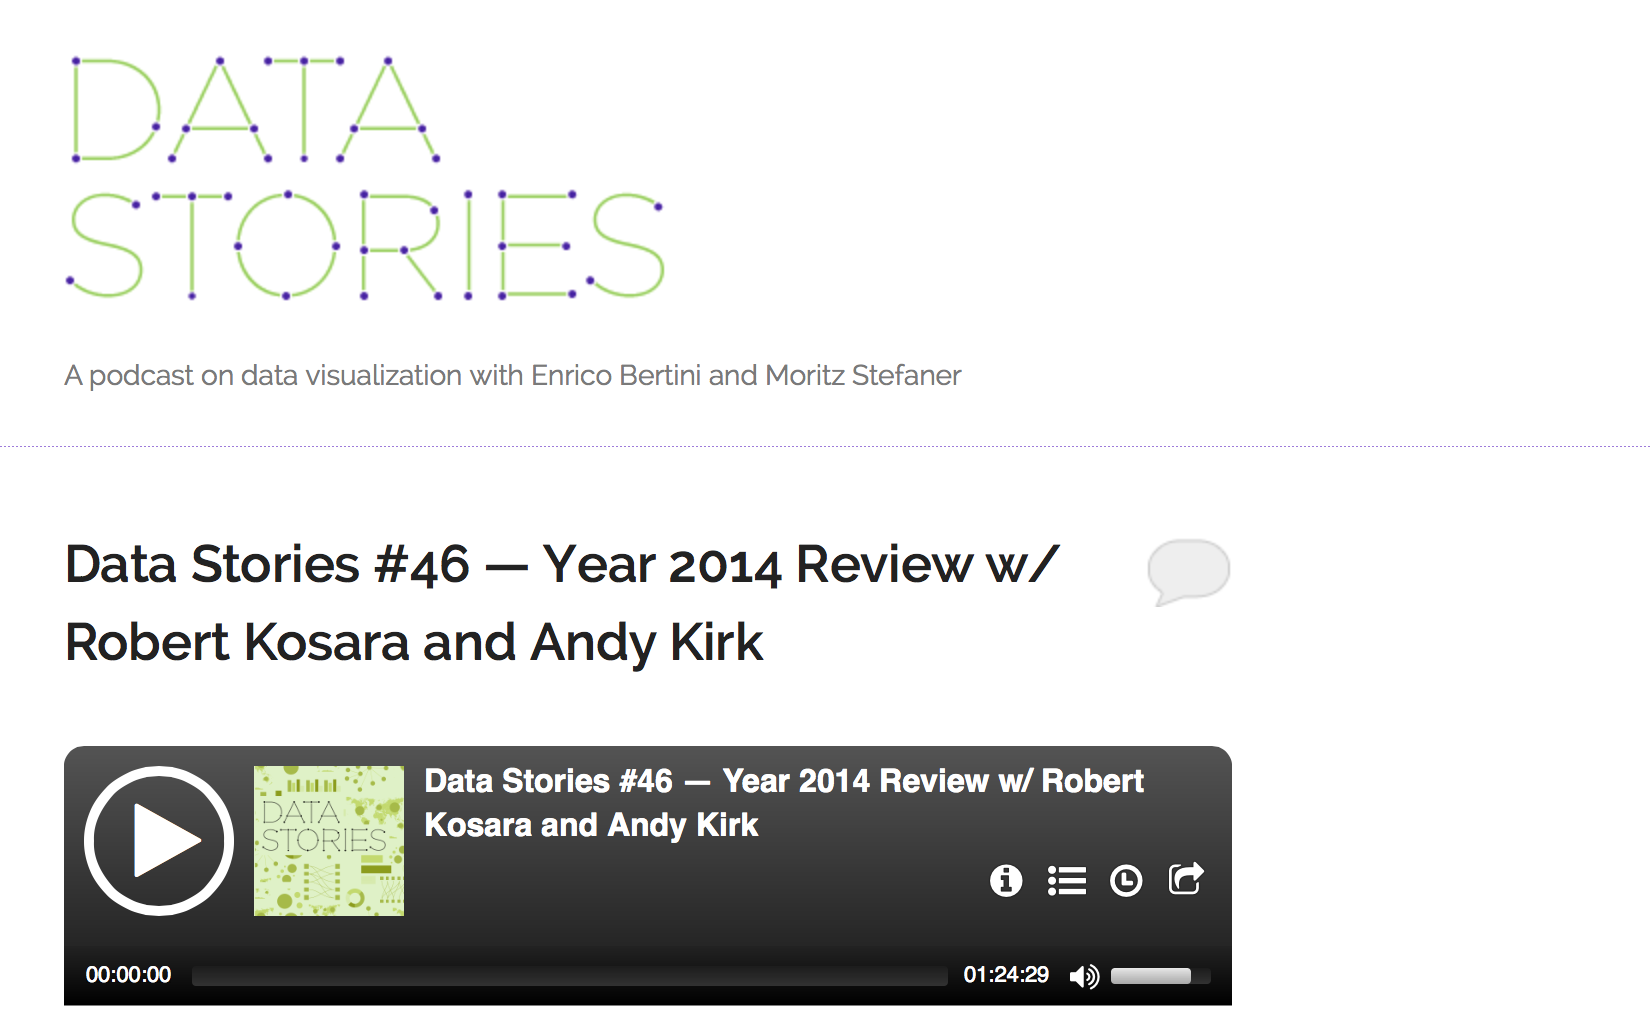
Blog 2015 (54 posts)

Link: The Tapestry YouTube Channel

We recently redesigned the Tapestry website, and unfortunately lost the archive page. It will definitely come back (and better than before), but in the meantime, there's the Tapestry YouTube Channel. You can watch all the talks from the last three years. This includes people like Hannah Fairfield, Alberto Cairo, Martin Wattenberg and Fernanda Viègas, Kim Rees, and many more.

Link: The NIPS Experiment

The conference on Neural Information Processing Systems (NIPS) has conducted a fascinating experiment: split the program committee into two and get 10% of submissions reviewed by both. The article I'm linking to above has a great analysis of what they found (and it's not encouraging).

Tapestry 2016 Open For Applications

Tapestry 2016 will take place March 9 next year in a historic hotel near Denver, CO. We have put together another exciting line-up of keynote speakers and are looking for applications from people who want to attend or speak.

VIS 2015 – Friday

The final day of the conference was much shorter, only one full session and then the closing with the capstone. Here is a report on a few more papers, the capstone, a panel left over from Thursday, and a few random tidbits.

VIS 2015 – Thursday

Between the sessions, parties, discussions, running, and the occasional short sleep break, I fell a bit behind on the blogging about VIS 2015. After separate postings for Tuesday and Wednesday, this part covers Thursday. The posting about Friday will be short, but squeezing both days into one felt like a bit too much.

VIS 2015 – Wednesday

The second full day of VIS 2015 brought lots of papers on applications and design studies, and also a panel on solved problems in visualization. As on the first day, I have some observations and thoughts.

When Details Hide the Story

Kaiser Fung doesn't like this graphic that accompanied a recent story about the bird flu in the Wall Street Journal. His redesign shows a lot less overlap and a lot more detail; so much, in fact, that it obscures the point of the chart.

Vizable, data worlds for iPad

Tableau today released a new visualization tool for iPad, called Vizable. This is a completely new app built specifically for exploring data using touch. It is based on a new approach to visual analysis that focuses on the data and task, rather than providing a chart toolbox.

VIS Running Club 2015

I will organize runs again at IEEE VIS in Chicago two weeks from now. As with previous years, organization will be minimal: just show up ready to run. I will prepare routes in the 3-6mi (5-10km) range.

Link: PolicyViz Blog and Podcast

Jon Schwabish is running a blog and podcast called PolicyViz. In both, he talks about communicating data and how to deal with numbers for the general public. He recently had two interesting guests back-to-back on his podcast: Nigel Holmes and Edward Tufte. Both episodes are well worth listening to.

Visualization Research, Part I: Engineering

Conventions in visualization can seem arbitrary, and quite a few are. But there is also a vast body of research, and it is growing every day. Just how does visualization research work? How do we learn new things about visualization and how it can and should be used?

Why Is Metadata So Hard?

The U.S. Department of Education just released an amazing dataset about the costs of going to college, earnings potential, etc. They're doing so many things right, it's really great. But what is still lacking is the metadata, making analysis harder than it needs to be.

Encounters with HCI Pioneers

Ben Shneiderman has put together a series of postings about the Pioneers of Human-Computer Interaction (HCI). Each includes a brief biography, some personal notes by Ben, as well as Ben's photos of them. The latter are particularly remarkable, often going back to the 1980s – like the gem at the top of this page, showing the man himself in 1986.

The Point Of A Chart

When creating charts, it's important to pick the one that actually fits not just the data, but the task. That can require going outside your comfort zone to use something beyond the four or five most common chart types. Here is an example where the original chart does not support comparison between two different sets of numbers, but it's easy to fix.

Talk: How to Visualize Data

Last week, I gave one of the visualization primer talks at BioVis in Dublin. My goal was to show people some examples, but also criticize the rather poor visualization culture in bioinformatics and challenge people to do better. Here is a write-up of that talk.

Link: Visualization Publication Data Collection

People from Georgia Tech, INRIA, University of Stuttgart, and other institutions have put together a comprehensive dataset of all papers presented at Vis/VisWeek/VIS since 1990. This was first collected for a set of visualizations last year, but has been updated with the 2014 data. They intend on keeping it up to date.

Link: Disinformation Visualization

In his piece Disinformation Visualization: How to lie with datavis, Mushon Zer-Aviv makes some interesting points about how framing the same data differently in visualization can make a big difference. Using the example of the abortion debate, he shows the usual chart tricks, cherry-picking, subsetting, etc., that is done to make the data support a particular story.

Report: EuroVis 2015

I attended EuroVis 2015 last week in Cagliari, Sardinia. This is the second-most important conference in the academic visualization world, and there were plenty of good sessions to choose from (full and short papers, state-of-the-art reports, and industry sessions).

EuroVis Running Club

I'm organizing a very informal running club at EuroVis next week. If you're attending the conference, don't forget to bring your running shoes and leave your excuses at home.

Feedback Loops for Better Talks

Feedback loops are a common concept in engineering. When it comes to giving talks, academics would do well to apply some of the thinking behind them to improve their output by observing how it deviates from the desired one, and making changes to adjust it.

Video: The Danger of Glitziness

Wayne Lytle created this video about the Viz-O-Matic that provides lots of tools to make visualization glitzier. It's a nice little spoof, and a throwback to the computer graphics of the early 1990s (it was made for SIGGRAPH 1993). This video was brought up in a discussion about storytelling at CHI last week, though I don't think that its lessons are very deep on that subject.

Conference Report: CHI 2015

Last week, I had the pleasure of attending the CHI 2015 conference in Seoul, South Korea. CHI technically stands for Computer-Human Interaction, but it has become a name rather than an acronym in recent years. And CHI’s scope is very broad, it covers many areas that are not strictly part of HCI (Human-Computer Interaction – why use one acronym when you can have two?).

Link: The Power of Wee Things

Lena Groeger (of ProPublica) has written a beautiful piece about the Power of Wee Things. She talks about using small things, multiples, and units to display data and get people interested. The article goes through many, many examples covering many different areas and ideas. She also gave a great talk on the topic at OpenVis 2014.

Link: Design and Redesign in Data Visualization

Fernanda Viégas and Martin Wattenberg have written a wonderful piece titled Design and Redesign in Data Visualization about criticism in data visualization. They thoughtfully analyze the practice and point out some of the issues when people create redesigns, including intellectual honesty and perfect hindsight.

Link: Dear Data

Giorgia Lupi and Stefanie Posavec are collaborating on a clever and beautiful new project they call Dear Data (Twitter account). Every week, they are sending post cards to each other with hand-drawn visualizations of data they have gathered: public transportation, ways they communicate, etc.

Link: Data Journalism in the 19th Century

Scott Klein of ProPublica has written a great story about an early use of data in journalism, and Horace Greeley, the colorful journalist behind it. Greeley found an issue and then gathered the data to show the extent of the problem. This is not unlike today.

Complications

In watches, a complication is anything that goes beyond the basic function of showing the current time: alarm time, moon phase, etc. I think the term should be adopted in user interface design and visualization.

Link: CG&A Article on Tapestry

I've written a short piece about the Tapestry conference for the Graphically Speaking column in Computer Graphics and Applications. The article talks about the reasoning behind Tapestry, how it's different from academic conferences, and gives a few examples of talks. It even includes anecdotal evidence to show that the conference has enabled actual knowledge transfer.

The Value of Illustrating Numbers

Showing data isn't always about trying to convey an insight, or giving people the means to understand the intricacies of data. It can also be a tool to communicate a fact, an amount, or an issue beyond just the sheer numbers. Data illustration is poorly understood, but it can be very powerful.

Link: The Graphic Continuum

The Graphic Continuum is a poster created by Jon Schwabish and Severino Ribecca (the man behind the Data Visualisation Catalogue). It lists almost 90 different chart types and organizes them into five large groups: distribution, time, comparing categories, geospatial, part-to-whole, and relationships. Some of them are connected across groups where there are further similarities. The poster is printed very nicely and makes for a great piece of wall art to stare at when thinking about data, and maybe to get an idea for what new visualization to try.

Video: Nigel Holmes on Humor in Visualization and Infographics

In this talk, Nigel Holmes talks about the value of and use of humor in communicating visualization. He also has some interesting criticism of academic visualization research (and also some more artistic pieces). It's a fun and interesting talk, as always with Nigel Holmes.

Link: Becksploitation: The Over-Use of a Cartographic Icon

The paper Becksploitation: The Over-Use of a Cartographic Icon by Kenneth Field and William Cartwright in The Cartographic Journal describes Harry Beck's famous map of the London Underground and what makes it great. It also offers a collection of misuses of the superficial structure, and critiques them. I wish we'd had papers (and titles!) like this in visualization.

Spelling Things Out

When visualizing data, we often strive for efficiency: show the data, nothing else. But there can be tremendous value in redundancy to make a point and drive it home. Two recent examples from news graphics illustrate this nicely.

Link: Tapestry 2015

Tapestry 2015 will take place March 4 in Athens, GA. This is the third time we are holding the conference, and it is again taking place on the day before NICAR. As in the past years, have a kick-ass line-up of speakers.

Seminal InfoVis Paper: Treisman, Preattentive Processing

A paper on a specific cognitive mechanism may seems like an odd choice as the first paper in this series, but it is the one that sparked the idea for it. It is also the one that has its 30th birthday this year, having been published in August 1985. And it is an important paper, and could play an even bigger role in visualization if properly understood and used.

Seminal InfoVis Papers: Introduction

Some of the most fundamental and important papers in information visualization are around 30 years old. This is interesting for several reasons. For one, it shows that the field is still very young. Most research fields go back much, much further. Even within such a short time frame, though, there is a danger of not knowing some of the most important pieces of research.

Link: Data Viz Done Right

Andy Kriebel's Data Viz Done Right is a remarkable little website. He collects good examples of data visualization and talks about what works and what doesn't. He does have bits of criticism sometimes, but he always has more positive than negative things to say about his picks. Good stuff.

Why Is Paper-Writing Software So Awful?

The tools of the trade for academics and others who write research papers are among the worst software has to offer. Whether it’s writing or citation management, there are countless issues and annoyances. How is it possible that this fairly straightforward category of software is so outdated and awful?

Links: 2014 News Graphics Round-Ups

In the past, it used to be difficult to find news graphics from the main news organizations. In the last few years, they have started to post year-end lists of their work, which are always a treat to walk through. With the new year a few weeks behind us, this is a good time to look at these as collections of news graphics.

The State of Information Visualization, 2015

It seems to be a foregone conclusion that 2014 was not an exciting year in visualization. When we recorded the Data Stories episode looking back at 2014 last week (to be released soon), everybody started out with a bit of a downer. But plenty of things happened, and they point to even more new developments in 2015.

Link: Businessweek Vintage Graphics

The BizWeekGraphics tumblr (well worth following in general) has a series of postings with a beautiful collection of graphics from the very early days of Businessweek, and also some more recent ones.