New Vis Research Blog: Multiple Views
While activity on this site has been a bit slow this year, I’ve helped start a new group blog focused on visualization research, called Multiple Views.
While activity on this site has been a bit slow this year, I’ve helped start a new group blog focused on visualization research, called Multiple Views.
The final report from VIS 2018 (see previously here and here) again covers papers, papers, and more papers. There are new ways to specify visualizations, a panel, perception research, as well as new work on how to deal with uncertainty in data.
While the first part of this report covered mostly workshops and other events, it's all papers from now on. Plus a session on the future of the VIS conference.
The IEEE VIS conference is the most important outlet for academic research. This year's conference took place in Berlin, Germany. Here is a report on some of the most interesting (to me, anyway) papers, events, and developments, in three parts.
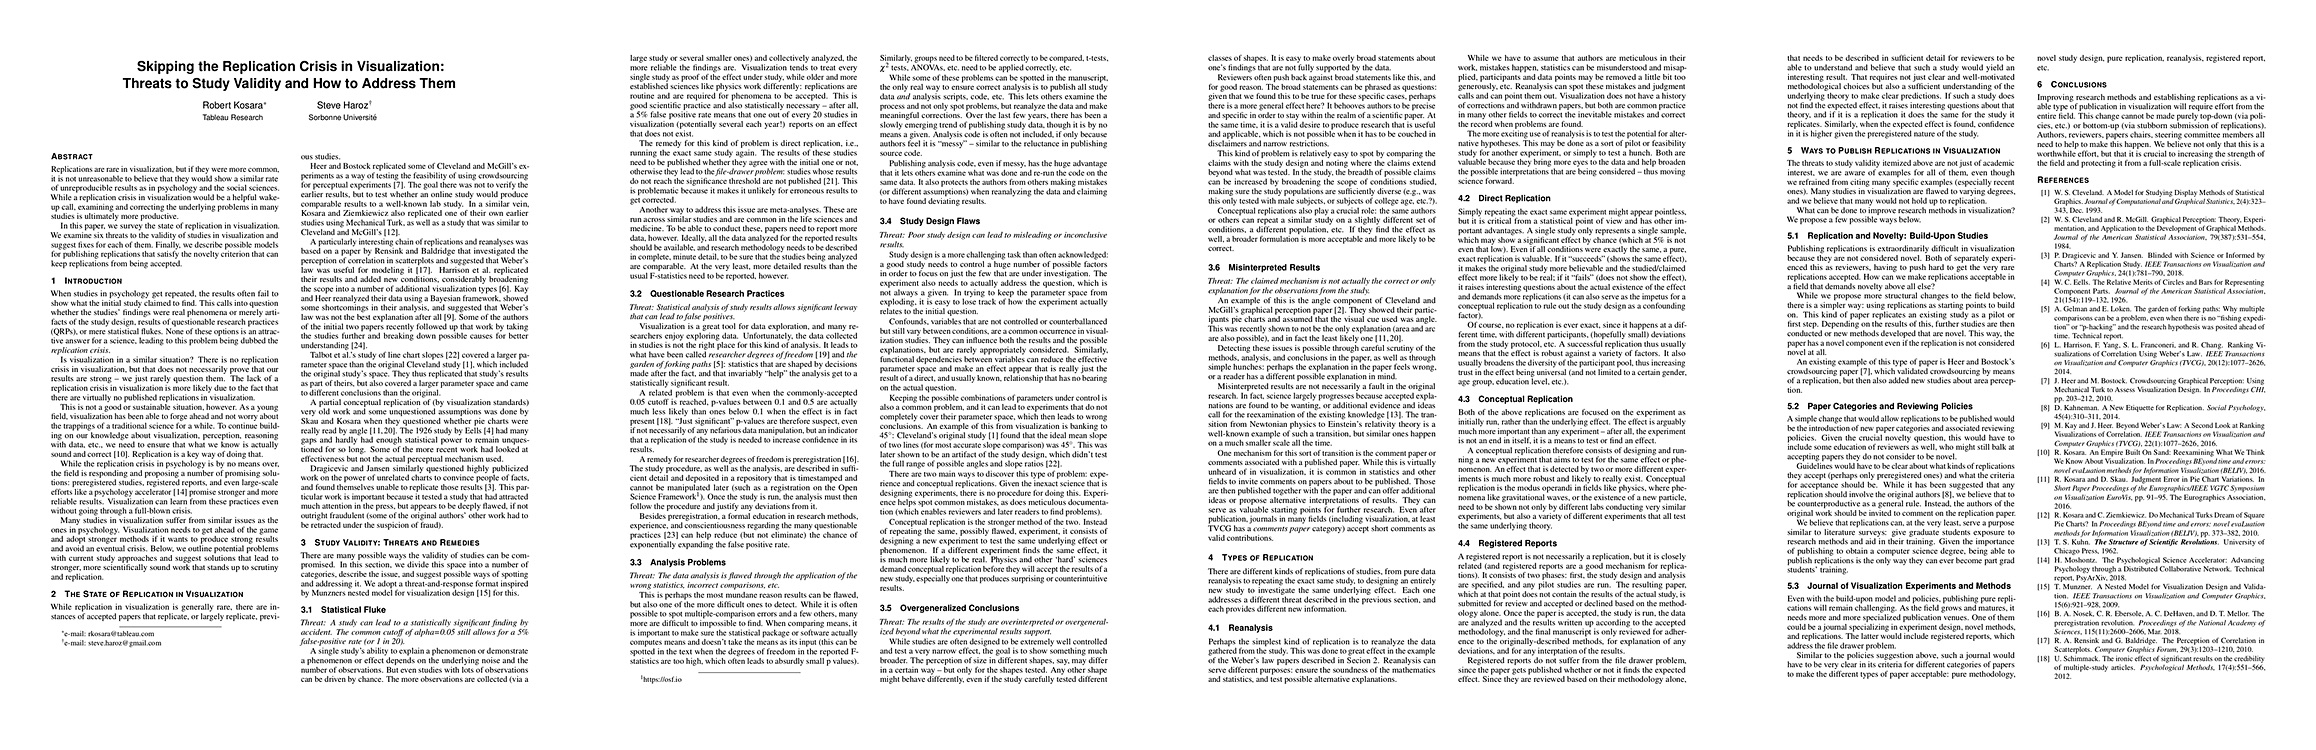
Visualization doesn't have the replication issues that some other fields are struggling with right now, but is that because our science is so strong or because nobody actually bothers with replications? And what can we do to get ahead of potential problems before we run into a full-on crisis? In a paper to be presented at BELIV, Steve Haroz and I list potential pitfalls and present possible solutions.
EuroVis raged on through the end of the week with talks, posters, and lots of food. This second part covers papers about visualization evaluation, high-dimensional structures, graph layouts, etc., as well as the capstone and closing (with information about next year).
EuroVis 2018 in Brno, Czechia, is in full swing. The first two days included workshops, the opening with a very fun and interesting keynote, and some good papers.
If you're into visualization for communication and storytelling, these two events should be on your radar: the Visualization for Communication Workshop (VisComm) at VIS and Tapestry 2018.
Jason Dykes is professor at City University London, where he also co-leads the giCentre. He straddles the line between cartography and visualization, publishing in both communities and combining ideas from both – which have led to crossover ideas like spatially-ordered treemaps and map lineups.
The academic visualization community largely comes from computer science: most of the professors teach in computer science (or similar) departments, most of the students doing research are computer science students of some flavor or other. It's interesting to consider how the field might be different if visualization had emerged from a different discipline.
I recently attended CHI 2018 in Montréal, QC. Normally conferences leave me excited for the next idea or the next direction (and also physically exhausted). This was one of the first where I was left feeling terrified: a lot of the work did an excellent job of highlighting core problems about our assumptions as visualization researchers, and poked at big intractable issues that I had mostly been ignoring for a long time. Here are the seven most terrifying talks.
It can be hard to get excited about the standard datasets that we keep using to show how visualization and statistics work. But if that's the case for you, it's not the datasets's fault, it's you! Here’s how to keep that spark going!
Time to wake up from the eagereyes winter hibernation with an aromatic potpourri! This time, we have news about pies, stippling, colors, sorting algorithms, and a few more. Also a video of my collaborator Noeska singing the praises of medical visualization.
When maps are used to display data, there is often a discrepancy between the data being shown, which almost never relates to area, and the area of the different parts of the map. This is particularly common in election maps. This new map of votes in the 2016 U.S. Presidential election cleverly combines geography and data in a clear and compelling way.