Blog 2013 (42 posts, 2 archived)

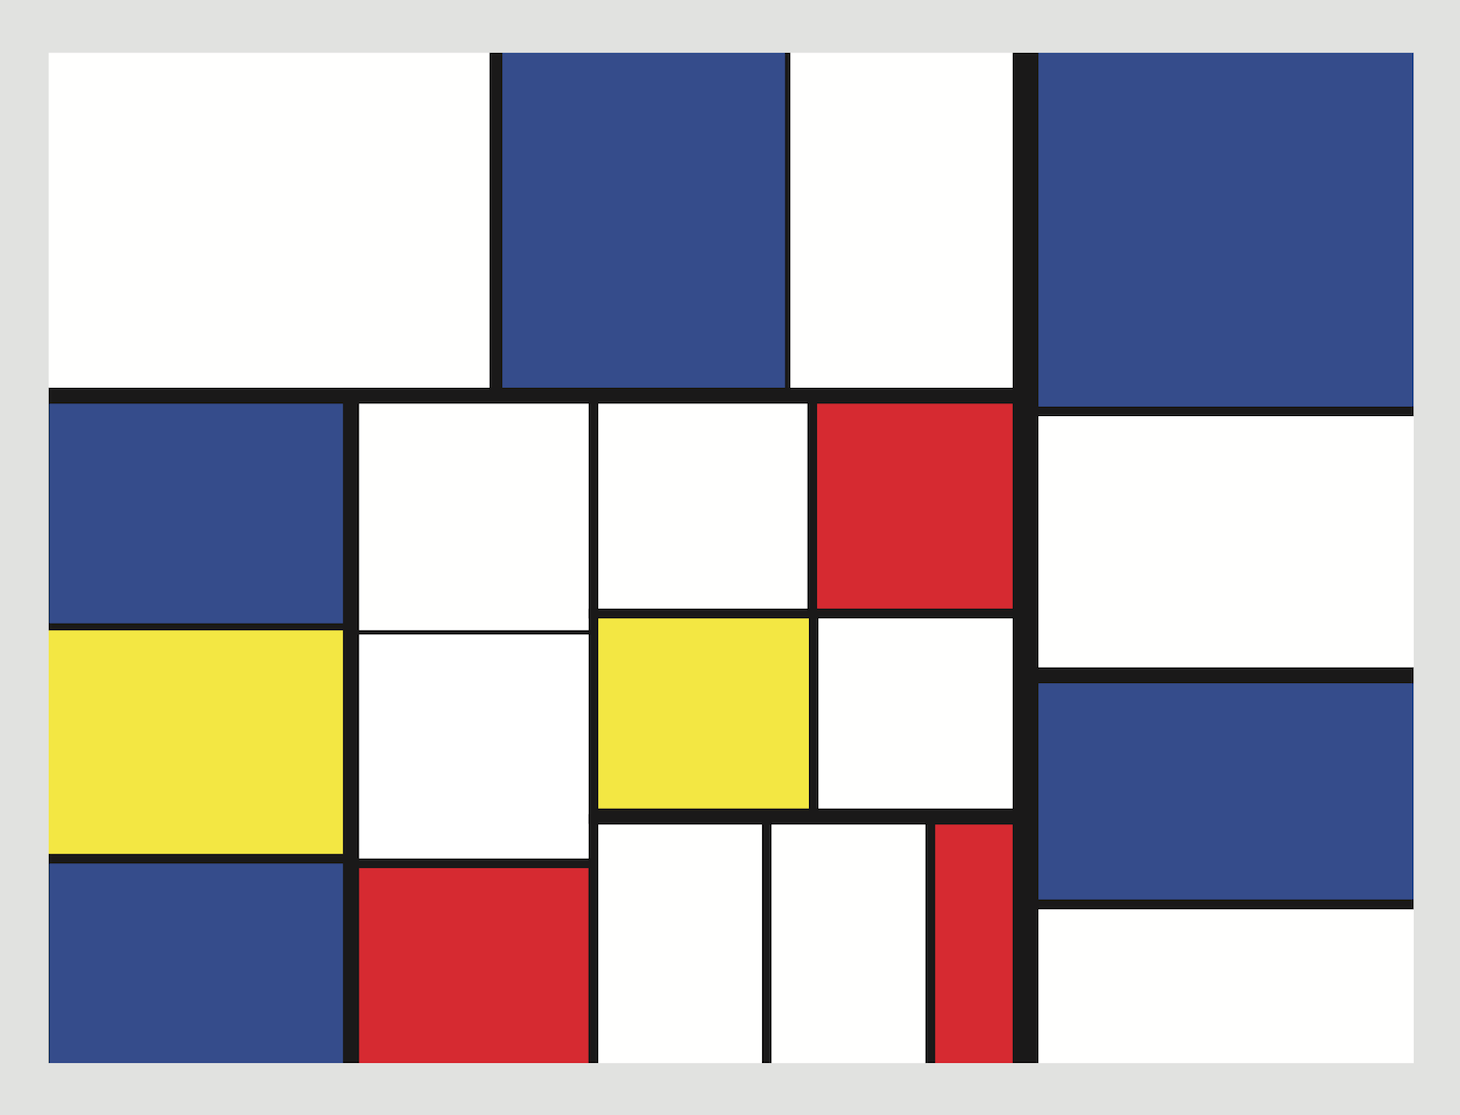
Ben Shneiderman's Treemap Art

Art imitates life, and sometimes art is inspired by research. Ben Shneiderman’s Treemap Art is unique in that it is the researcher himself (with Kazi Minhazur Rahman), rather than an artist, who has created the art pieces.

Scaling An Axis to Make A Point

A clever chart redesign last week got a lot of people talking about which one is “right.” What is more interesting to me is not which one is (supposedly) the better representation of the truth, but which purpose each one serves.

A Lack of Communication and Visibility

Finding visualization projects and pretty pictures on the web isn’t exactly difficult, but what about actual research? What if you wanted to know what’s going on in visualization, and get a sense of what current work is the most interesting? There is no resource for this that I’m aware of, but there should be.

A Guide to the Quality of Different Visualization Venues

I recently got an email from a colleague with the subject, “Academic research, is it all bad?” He had looked at a paper presented at a VIS workshop that people were pointing to on Twitter, and had found it lacking (“it’s just a blog posting”). While there are high-quality venues for visualization research, it’s not easy to be sure which ones are good, and which ones are lower quality.

Tapestry 2014 Announced

After a very successful Tapestry conference in February this year, we have been getting a steady stream of questions from people about another event next year. Now we're finally able to announce next year's event. And it will be awesome, again.

The Seven Year Itch

Eagereyes.org turned seven years old last week, on October 1st. Seven years is a long time on the web. In dog years, the site is almost fifty years old! Has it lost its edge? Have I gone soft? Where is the bite? Where is the fight?

Story Points

I consider presentation and storytelling the next step in visualization, after most of the focus has been on exploration and analysis so far. An upcoming version of Tableau will include a feature called Story Points, which supports presentation directly in the visualization tool.

Watch the TCC Keynote Live on Monday

The Tableau Customer Conference (TCC) starts tomorrow with a big keynote that includes demos of upcoming features. Watch it live at this link, and see me demo something new and exciting.

Another Look at Many Eyes, 18 Months Later

In February of last year, I wrote a posting based on some data I had scraped from Many Eyes, and criticizing where I thought it was going (or not going). Here is an update, eighteen months later, of some of the things that have happened in the meantime, and some new data.

Thoughts on Blogging

I was recently asked some questions via email about blogging. Rather than respond via email, I’ve decided to do a Gelman and post my response here.

The Perfect Visualization

There are many rules about how to visualize data. We know how to encode specific types of data, what visual encodings work well, and what does not work so well. But is there such a thing as a perfect visualization for a given set of data?

The Golden Age of Information Graphics

Infographics today are mostly pointless decorations around a few simple facts that add nothing meaningful. But information graphics once deserved their name with dense, meticulously-drawn, well-researched information. Here is an example from 1944.

What Means Mean

Data is often reported as a single number. Unemployment rates, housing prices, crime, etc. are all boiled down to single numbers that average over a large population. But averages, or means, hide much of the richness of the underlying data, and without at least a sense of the spread of the data values, are largely meaningless.

The Most Iconic Visualizations

I was asked about the most iconic data graphics in the last ten years for an article on FastCoLabs last week (so were Andy Kirk and Matt Stiles). It's an interesting question not only because of the actual choices, but also the criteria to use. Is something iconic because of its unique look and/or shape? Does it have to have impact? What is an iconic visualization?

GED Viz, A Data Storytelling Tool

I had the honor and pleasure to keynote an event in Berlin recently that introduced a new visualization tool to the world, GED Viz. What makes it stand out from other web-based visualization tools is its focus on particular data, and the ability to create not just individual views, but little stories.

It's Just Too Easy

Once you’ve seen one visualization book, you’ve seen them all. They tend to all look similar, use the same examples, and don’t provide much depth. Is it too easy to write a book when you can use such compelling images?

Conference Report: Tapestry 2013

About 100 attendees, three keynotes, five short talks, demos, discussions, food, music, and a fantastic atmosphere: the Tapestry conference for storytelling with data took place on February 27 in Nashville, TN. Here is a conference report with links to talk videos, as well as some first news on Tapestry 2014.

How The Rainbow Color Map Misleads

Colors are perhaps the visual property that people most often misuse in visualization without being aware of it. Variations of the rainbow colormap are very popular, and at the same time the most problematic and misleading.

Aspect Ratio and Banking to 45 Degrees

The same data can look very different in a line chart depending on its aspect ratio. But what is the perfect shape for a chart? A square? A rectangle? Which rectangle? It depends on the data.

Schloß Dagstuhl

For many computer science researchers, the name Dagstuhl rings a bell. Anybody who has been there has fond memories of interesting talks, great conversations, and lots of social interaction (lubricated by the abundantly available wine and beer). But what is Dagstuhl?

Why the Obsession with Tables?

Lots of data are still presented and released as tables. But why, when we know that visual representations are so much easier to read and understand? Eric Newburger from the U.S. Census Bureau has an interesting theory.

Continuous Values and Baselines

One of the most common mistakes people make when creating charts is to cut off the vertical axis. But why is that a problem? And what can you do when you need to show data where the amount of change is small compared to the absolute values?

Data: Continuous vs. Categorical

Data comes in a number of different types, which determine what kinds of mapping can be used for them. The most basic distinction is that between continuous (or quantitative) and categorical data, which has a profound impact on the types of visualizations that can be used.

How to Keep Following eagereyes After the End of Google Reader

With Google Reader shutting down July 1st, now is the time to find alternative ways to follow your favorite blogs. For this one, you can now get new postings on Facebook and through a dedicated Twitter feed, in addition to the RSS feed. See below for some RSS aggregator/reader alternatives to Google Reader.

The Revolution Will Be Visualized

In the 1970s, it was the protest songs. In the 1980s, it was the anti-war movies. Today, the protest is no longer happening in songs or movies. Today, it’s online, based on data, and using visualization.

Glimpses of Data: The CBO's Snapshots

Arguments in data visualization are so fierce because the stakes are so low is a great zinger that I’ve heard a few times recently. But it’s not always true. Data visualization influences important decisions every day. The Congressional Budget Office’s new snapshots are but one example.

Study on Creative Data Visualization

To explore how we can make it easier to create new visualization designs, we are running a study based on a new approach, called visualization primitives. It lets you map data to the properties of objects like rectangles and ellipses. Build something with data, have fun, and help us figure out if it works!

A Better Definition of Chart Junk

Maximizing the data-ink ratio sounds like a good idea, but when actually followed to the letter produces terrible and nonsensical results. Here is a more reasonable definition of chart junk that does away with the pretense of a mathematical formula and puts some common sense back into the question of good chart design.

Tableau Desktop Now Free For University Students

If you are a student at a university, you can now get a free license for the full version of Tableau Desktop. No matter if you use it in class or for research, this is the full version that does not restrict the amount of data or the kind of connectivity (like Tableau Public does). The license is good for one year and can be renewed as long as you are enrolled at university.

Visualization Makes Things Real

Vision is the sense we most identify with: it tells us where we are, who we are talking to, what we are doing. It defines our world like no other sense. What we can see is real, for better or worse.

Data Storytelling in Video

I'm not a fan of video. I don't spend time randomly surfing YouTube, and when given the choice between reading an article and watching a video, I'll read. The reason is that videos often don't work well for me: they're too fast or too slow, they take a long time to get to the point, they don't let me skip around and browse easily. I'd rather be in control than having the information pre-packaged for me. But two examples have surfaced in the last few days that show data visualization can tell a very effective story in well-designed, well-paced videos.

The ISOTYPE

Communicating data visually is not only about perception and precision, but also understanding. ISOTYPE was developed to bridge the gap between showing data in a way that's easy to read and at the same time easier to understand than unadorned bar charts.

The Halfway House To Nowhere

What is visualization for? Is it a tool help us understand data and the world, and to make better decisions because of that? Or is it just a debugging tool, a stepping stone towards intelligent machines?

Paper: Storytelling, The Next Step for Visualization

Visualization is often considered to consist of three phases: exploration, analysis, and presentation. While the former two topics are covered well in the literature, there has been very little work specifically on presentation. In an upcoming paper, Jock Mackinlay and I argue that presentation, and in particular storytelling and communication of data, are the logical next step for the field, and provide some research directions.