Readability and Precision in Pictorial Bar Charts

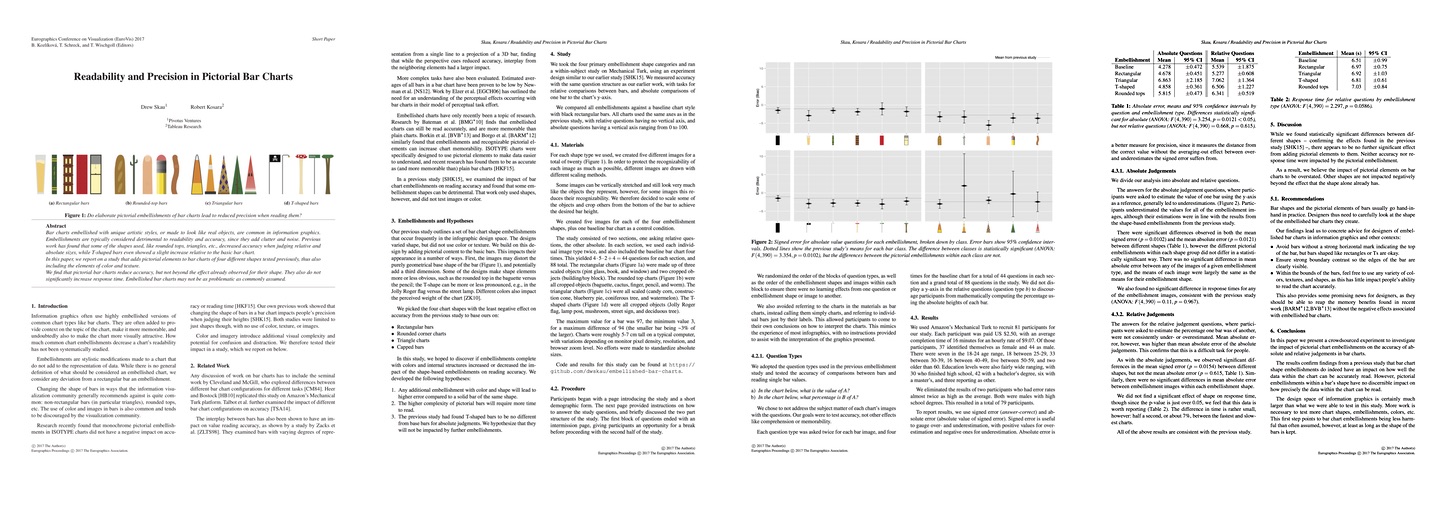
Drew Skau, Robert Kosara, Readability and Precision in Pictorial Bar Charts, Short Paper Proceedings of the Eurographics/IEEE VGTC Symposium on Visualization (EuroVis), 2017. DOI: 10.2312/eurovisshort20171139Bar charts embellished with unique artistic styles, or made to look like real objects, are common in information graphics. Embellishments are typically considered detrimental to readability and accuracy, since they add clutter and noise. Previous work has found that some of the shapes used, like rounded tops, triangles, etc., decreased accuracy when judging relative and absolute sizes, while T-shaped bars even showed a slight increase relative to the basic bar chart. In this paper, we report on a study that adds pictorial elements to bar charts of four different shapes tested previously, thus also including the elements of color and texture. We find that pictorial bar charts reduce accuracy, but not beyond the effect already observed for their shape. They also do not significantly increase response time. Embellished bar charts may not be as problematic as commonly assumed.
@inproceedings{Skau:EuroVis:2017,
	year = 2017,
	title = {Readability and Precision in Pictorial Bar Charts},
	author = {Drew Skau and Robert Kosara},
	booktitle = {Short Paper Proceedings of the Eurographics/IEEE VGTC Symposium on Visualization (EuroVis)},
	doi = {10.2312/eurovisshort20171139},
	abstract = {Bar charts embellished with unique artistic styles, or made to look like real objects, are common in information graphics. Embellishments are typically considered detrimental to readability and accuracy, since they add clutter and noise. Previous work has found that some of the shapes used, like rounded tops, triangles, etc., decreased accuracy when judging relative and absolute sizes, while T-shaped bars even showed a slight increase relative to the basic bar chart. In this paper, we report on a study that adds pictorial elements to bar charts of four different shapes tested previously, thus also including the elements of color and texture. We find that pictorial bar charts reduce accuracy, but not beyond the effect already observed for their shape. They also do not significantly increase response time. Embellished bar charts may not be as problematic as commonly assumed.},
}
