Evidence for Area as the Primary Visual Cue in Pie Charts
Robert Kosara (2019). Evidence for Area as the Primary Visual Cue in Pie Charts. In IEEE VIS Short Paper Proceedings. DOI: 10.1109/VISUAL.2019.8933547
BibTeX
@inproceedings{Kosara:VISShort:2019,
author = {Robert Kosara},
title = {Evidence for Area as the Primary Visual Cue in Pie Charts},
booktitle = {IEEE VIS Short Paper Proceedings},
year = {2019},
doi = {10.1109/VISUAL.2019.8933547}
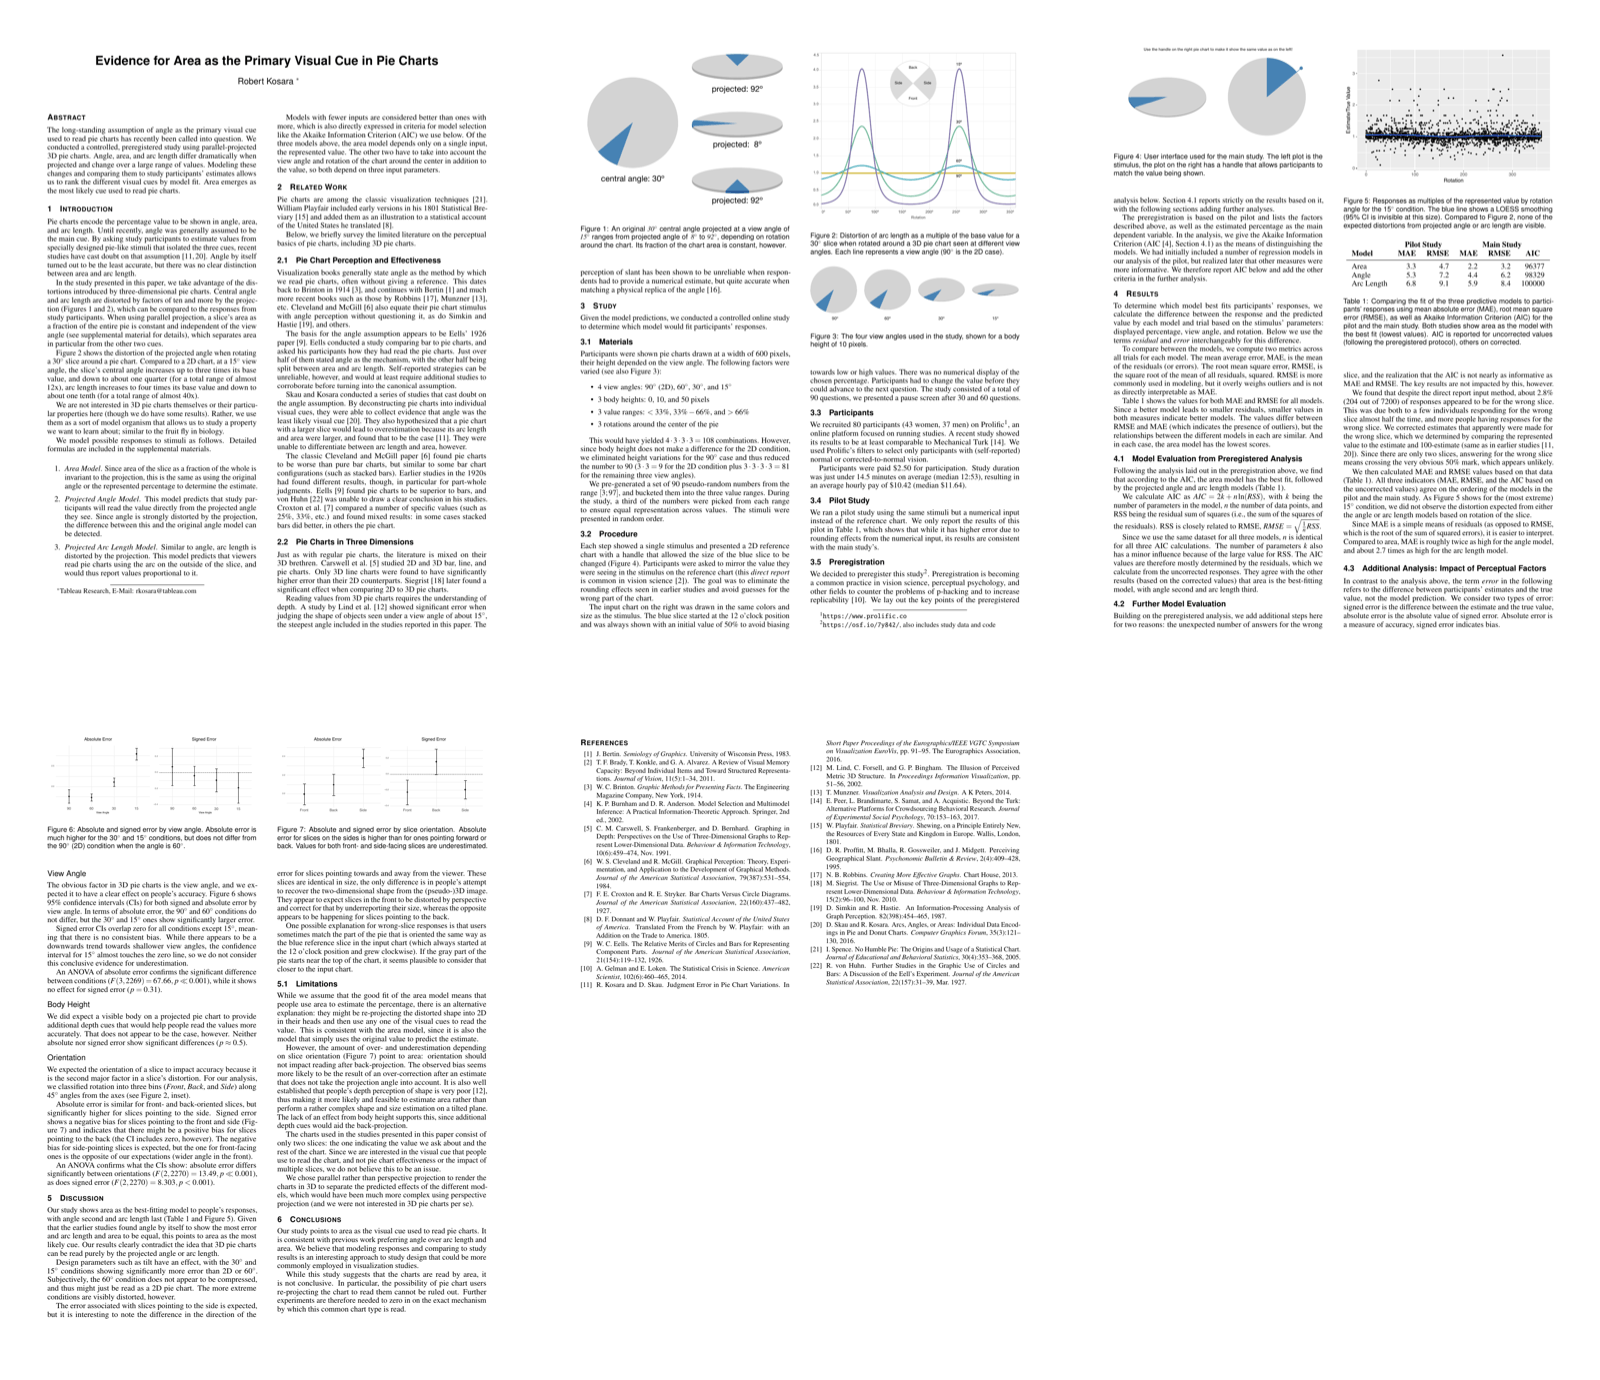
}The long-standing assumption of angle as the primary visual cue used to read pie charts has recently been called into question. We conducted a controlled, preregistered study using parallel-projected 3D pie charts. Angle, area, and arc length differ dramatically when projected and change over a large range of values. Modeling these changes and comparing them to study participants’ estimates allows us to rank the different visual cues by model fit. Area emerges as the most likely cue used to read pie charts.