The Impact of Distribution and Chart Type on Part-to-Whole Comparisons
Robert Kosara (2019). The Impact of Distribution and Chart Type on Part-to-Whole Comparisons. In Short Paper Proceedings of the Eurographics/IEEE VGTC Symposium on Visualization (EuroVis). DOI: 10.2312/evs.20191162
BibTeX
@inproceedings{Kosara:EuroVis:2019b,
author = {Robert Kosara},
title = {The Impact of Distribution and Chart Type on Part-to-Whole Comparisons},
booktitle = {Short Paper Proceedings of the Eurographics/IEEE VGTC Symposium on Visualization (EuroVis)},
year = {2019},
doi = {10.2312/evs.20191162}
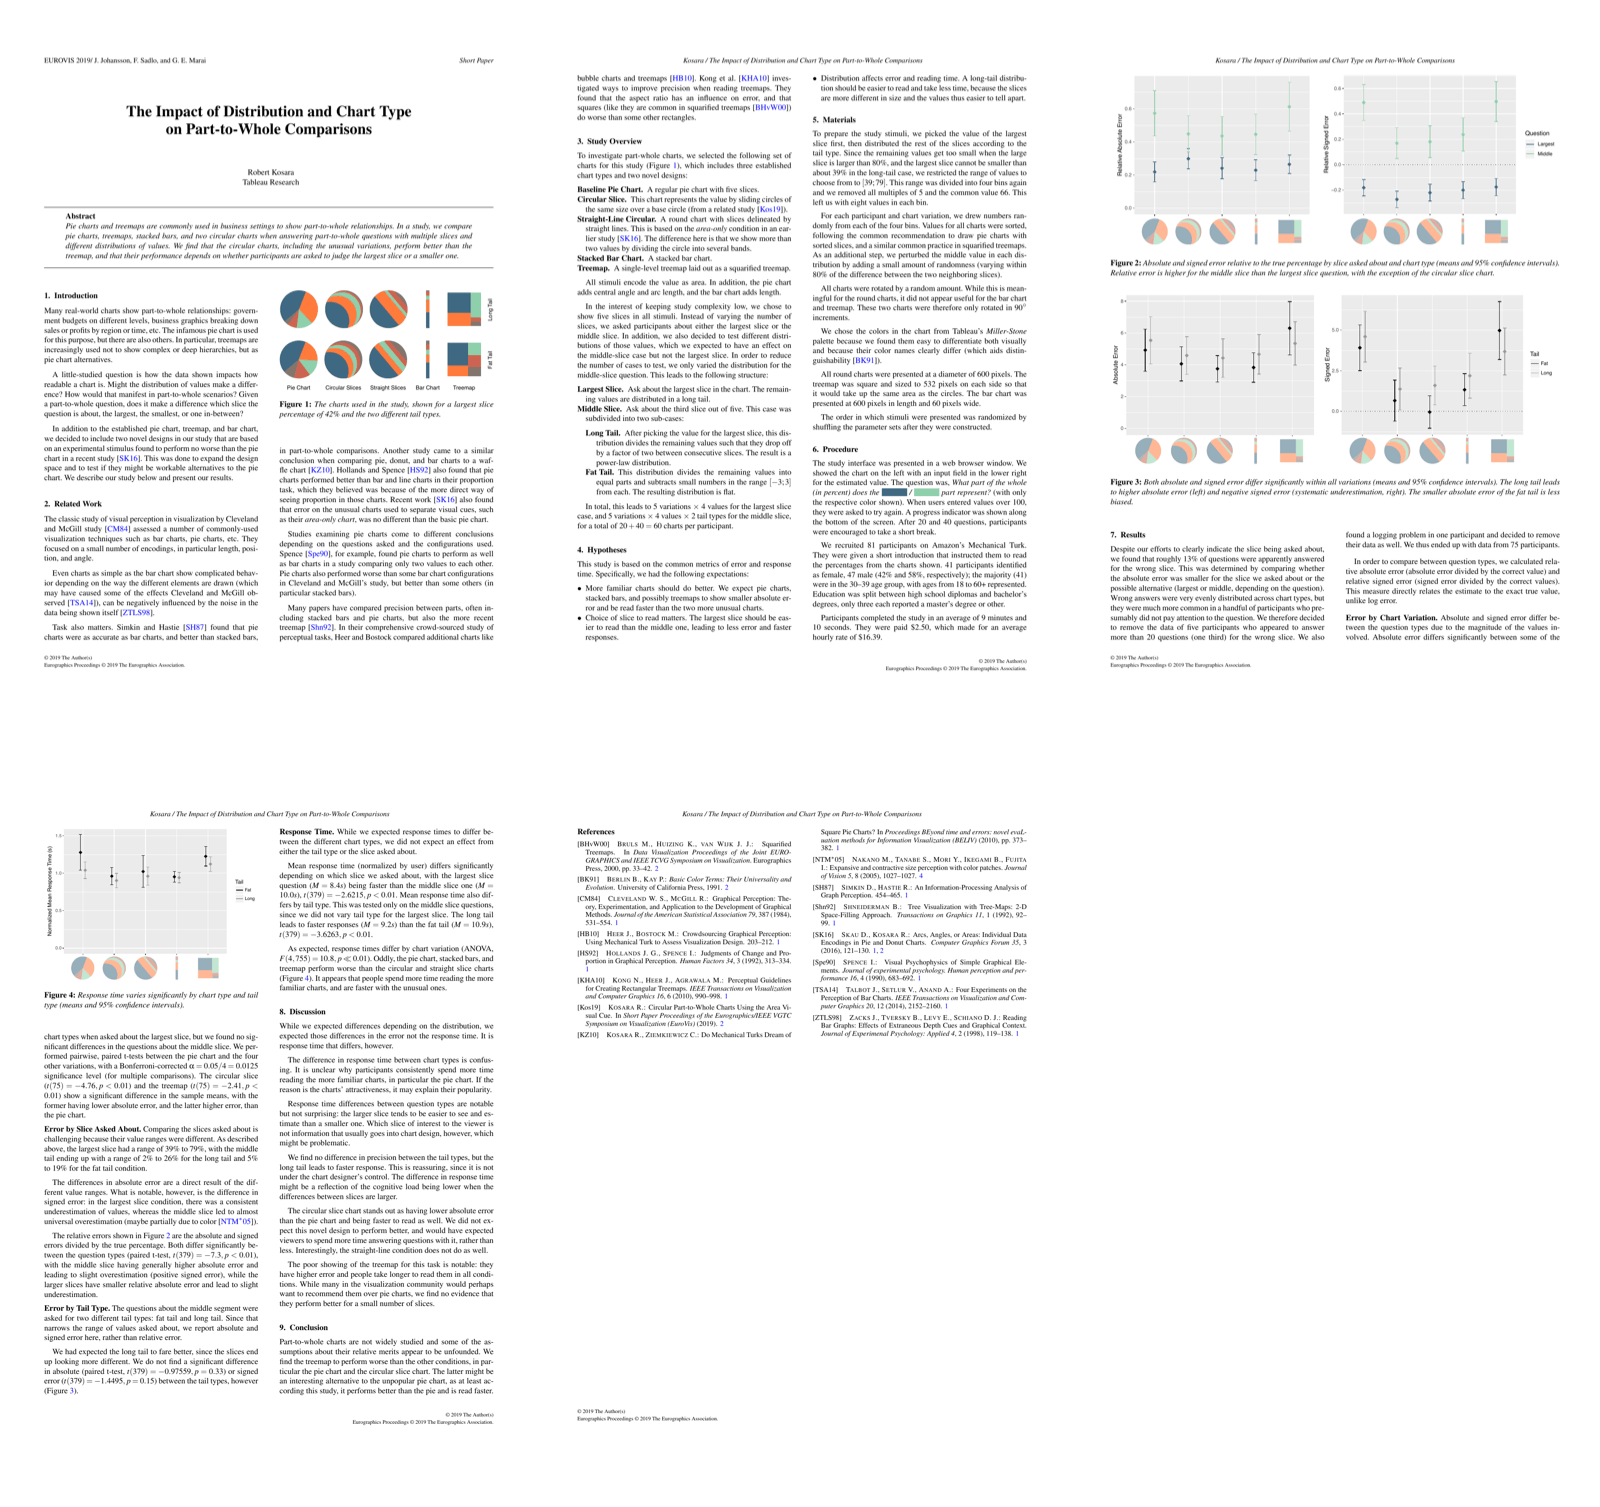
}Pie charts and treemaps are commonly used in business settings to show part-to-whole relationships. In a study, we compare pie charts, treemaps, stacked bars, and two circular charts when answering part-to-whole questions with multiple slices and different distributions of values. We find that the circular charts, including the unusual variations, perform better than the treemap, and that their performance depends on whether participants are asked to judge the largest slice or a smaller one.