Circular Part-to-Whole Charts Using the Area Visual Cue
Robert Kosara (2019). Circular Part-to-Whole Charts Using the Area Visual Cue. In Short Paper Proceedings of the Eurographics/IEEE VGTC Symposium on Visualization (EuroVis). DOI: 10.2312/evs.20191163
BibTeX
@inproceedings{Kosara:EuroVis:2019a,
author = {Robert Kosara},
title = {Circular Part-to-Whole Charts Using the Area Visual Cue},
booktitle = {Short Paper Proceedings of the Eurographics/IEEE VGTC Symposium on Visualization (EuroVis)},
year = {2019},
doi = {10.2312/evs.20191163}
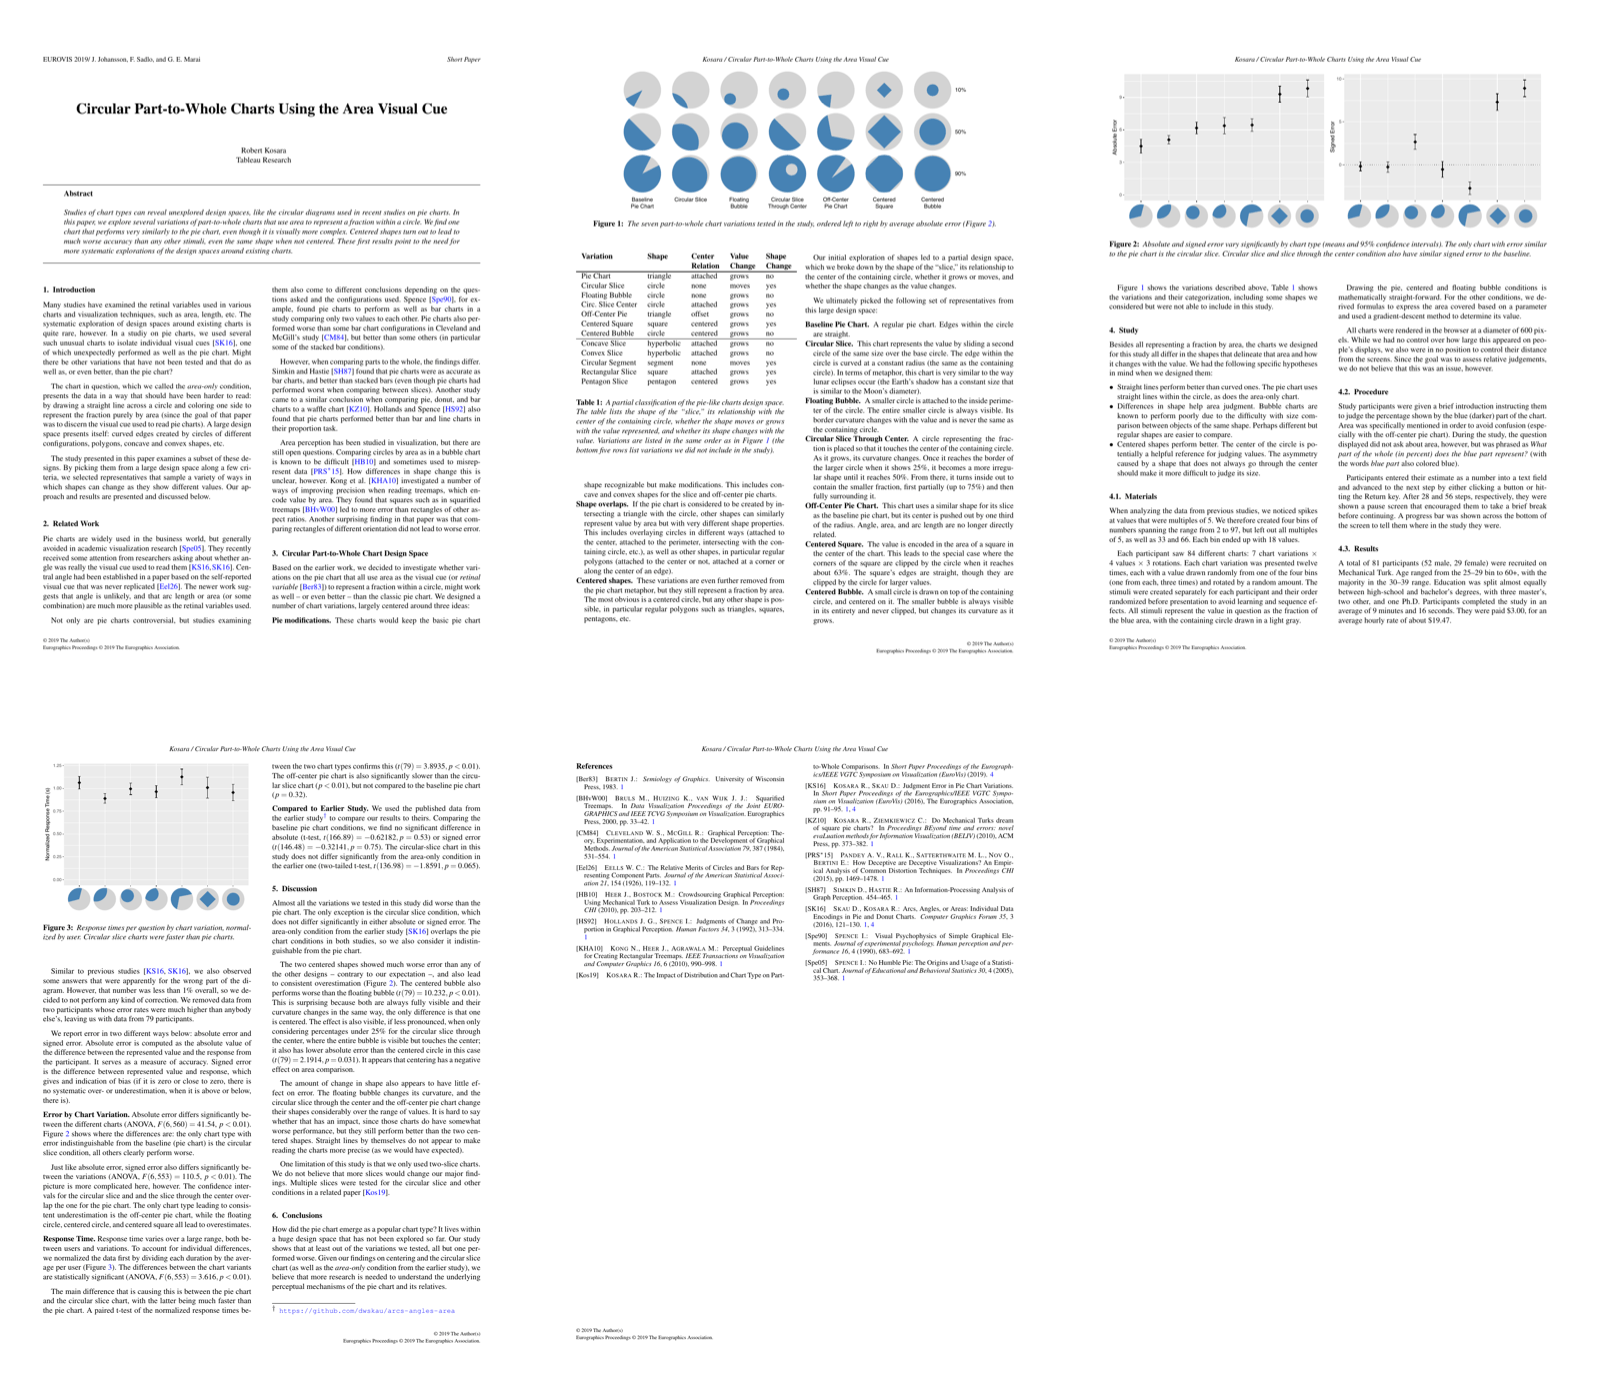
}Studies of chart types can reveal unexplored design spaces, like the circular diagrams used in recent studies on pie charts. In this paper, we explore several variations of part-to-whole charts that use area to represent a fraction within a circle. We find one chart that performs very similarly to the pie chart, even though it is visually more complex. Centered shapes turn out to lead to much worse accuracy than any other stimuli, even the same shape when not centered. These first results point to the need for more systematic explorations of the design spaces around existing charts.