Meta Parallel Coordinates for Visualizing Features in Large, High-Dimensional, Time-varying Data
Aritra Dasgupta, Robert Kosara, & Luke Gosink (2012). Meta Parallel Coordinates for Visualizing Features in Large, High-Dimensional, Time-varying Data. In Symposium on Large-Scale Data Analysis and Visualization (LDAV) (pp. 85–89). DOI: 10.1109/LDAV.2012.6378980
BibTeX
@inproceedings{Dasgupta:LDAV:2012,
author = {Aritra Dasgupta and Robert Kosara and Luke Gosink},
title = {Meta Parallel Coordinates for Visualizing Features in Large, High-Dimensional, Time-varying Data},
booktitle = {Symposium on Large-Scale Data Analysis and Visualization (LDAV)},
year = {2012},
pages = {85–89},
doi = {10.1109/LDAV.2012.6378980}
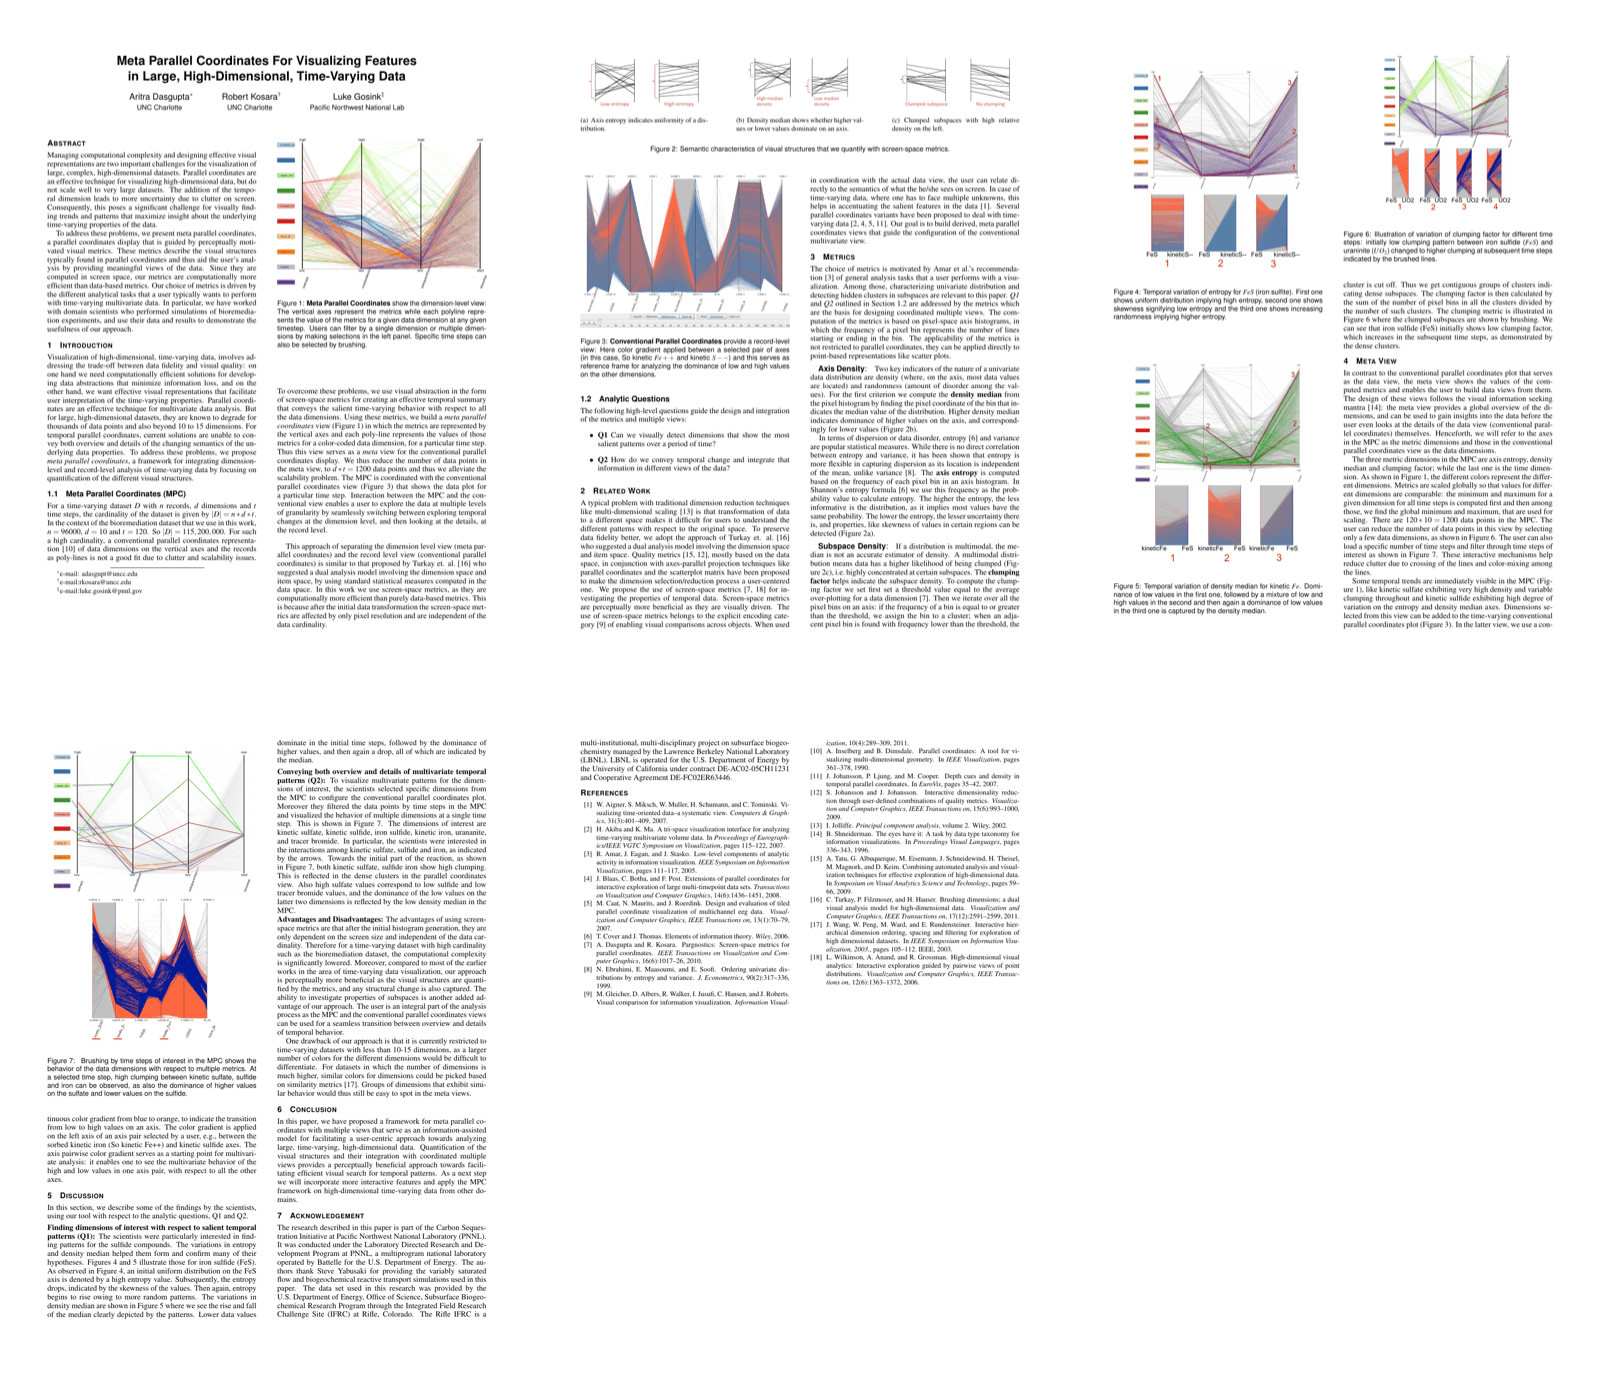
}Managing computational complexity and designing effective visual representations are two important challenges for the visualization of large, complex, high-dimensional datasets. Parallel coordinates are an effective technique for visualizing high-dimensional data, but do not scale well to very large datasets. The addition of the tempo- ral dimension leads to more uncertainty due to clutter on screen. Consequently, this poses a significant challenge for visually find- ing trends and patterns that maximize insight about the underlying time-varying properties of the data. To address these problems, we present meta parallel coordinates, a parallel coordinates display that is guided by perceptually motivated visual metrics. These metrics describe the visual structures typically found in parallel coordinates and thus aid the user’s analysis by providing meaningful views of the data. Since they are computed in screen space, our metrics are computationally more efficient than data-based metrics. Our choice of metrics is driven by the different analytical tasks that a user typically wants to perform with time-varying multivariate data. In particular, we have worked with domain scientists who performed simulations of bioremediation experiments, and use their data and results to demonstrate the usefulness of our approach.