The Year of InfoVis Theory
2010 is The Year of Information Visualization Theory. Here's why.
Setting the Stage
As I pointed out recently, there hasn't been much theoretical work at InfoVis in the last few years. With InfoVis becoming more mature, we need to develop a clearer understanding of how and why visualization works, how we can explore the design space more effectively, what solutions will likely work for a given data and task, etc.
Two papers at InfoVis 2009 set the stage for my bold prediction, Tamara Munzner's A Nested Model for Visualization Design and Validation and Chris Weaver's Conjunctive Visual Forms (PDF). Both are excellent papers that provide a lot of food for thought for further work.
Embedding InfoVis in Visual Representation
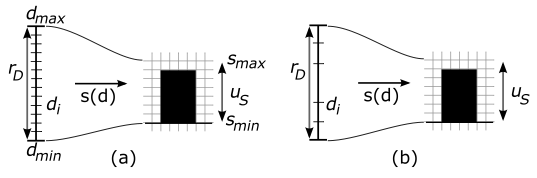
The Year itself starts with a book chapter: Caroline Ziemkiewicz and I contributed a chapter to a book, titled Embedding Information Visualization Within Visual Representation. The image at the top of this posting is from that chapter.
The idea was to extend Tory and Möller's work, which used two criteria (discrete vs. continuous data and given vs. chosen spatial layout) to classify visualization techniques. We introduce a number of criteria that mesh very well with those criteria, but shed additional light on both information visualization's internal structure, as well as how it is embedded in other forms of visual communication. Among the criteria we use are the type of mapping (surjective or bijective), readability and information loss, and the concept of notationality (developed by Nelson Goodman for visual languages). While it's not a full taxonomy, we did find some interesting connections between seemingly unrelated areas, and even have some ideas for combinations of criteria that are not yet covered.
Design Elements
Another paper Caroline and I just got accepted at Advanced Visual Interfaces (AVI) is titled Implied Dynamics in Information Visualization. We conducted a study to gauge the influence of design elements like lines, borders, separation of parts, etc., in simple charts like pie charts, bar charts, and a few others. We found some very interesting effects that suggest that people associate a lot of meaning with these seemingly meaningless "decorations."
In addition, we got some very interesting responses that point towards a perception of dynamism and movement in static scenes, even when looking at very simple graphical objects like charts. These can have an effect on the perception of the data being represented in a chart, and we are currently investigating these further.
InfoVis Theory Workshop (Planned)
Chris Weaver and I are planning to submit a workshop proposal on theory in InfoVis to VisWeek. The major goal is to get together people interested in theory to establish the need for this kind of research, discuss ideas, and develop strategies to get this work accepted more at the main venues. It's still tough to get theory papers accepted when they don't have a clear application, but so we need to figure out how to change the mindset a bit to carve out a viable theory niche.
We're still discussing the format, but it looks like we'll have several sessions with short position papers at the beginning of each to spark discussion. The focus will be on the discussions rather than the presentations, and we hope to end up with a lot of interesting ideas to compile into a whitepaper.
Beyond Bertin
Based on some of the recent work mentioned above, Caroline and I wrote a little article for the Visualization Viewpoints column in Computer Graphics and Applications (CG&A), to appear in the September/October issue. It's titled Beyond Bertin: Seeing the Forest Despite the Trees. If that sounds controversial, it was entirely unintended.
The paper argues for a more holistic view of visualization. Marks are a great basis, but we need to look at the bigger picture: how do we perceive entire visualizations? What part does the structure of the visualization play? How much information is in the marks, and how much is in the structure? Is a visualization really just a collection of marks?
Theresa-Marie Rhyne (the editor for Visualization Viewpoints) has timed that article perfectly with VisWeek. Together with the workshop (if it's accepted), that should make for some interesting discussions.
And More!
There is more coming, pending reviews and acceptance in various places. I also happen to know of one very theoretical paper (not involving yours truly) to be published this year in a visualization journal.
What else is there? Do you have work that you consider theory that is about to be published or that was published recently? Let me know below or via the contact form, I'm always looking for more of this kind of work. Also, let me know if you have thoughts on the workshop. We have an idea where we want to go, but it's still in an early stage. Any input from interested participants would be appreciated.
Comments (4)
Posting new comments was disabled in 2020.