HTML5 and Visualization on the Web
HTML5 is an upcoming new standard not just for web markup, but also new graphical features. It will make it possible to build interactive visualizations right in the web browser, written in JavaScript. And despite what you might think about JavaScript, they will be fast.
Why not Java or Flash?
The current way of building almost anything that's visual and interactive on a website is to use either Java or Flash. Many Eyes even uses both. And while both have great tool support and many developers that are familiar with them, there are also a lot of issues: startup takes a while, performance can be lacking, applications never look quite correct, keyboard shortcuts and accessibility features often don't work, etc.
HTML5's new features promise a much more integrated approach that makes live visualizations as much part of websites as images or text. Other parts of the page can interact with them, there is no seam between the visualization and the content. And on top of all that, they are fast and available everywhere.
SVG and Canvas
While there is a lot of interesting stuff in HTML5 in terms of telling the browser about the structure of your page, the two features that are the most relevant for visualization are known as SVG and the canvas element.
Scalable Vector Graphics (SVG) make it possible to create graphical objects in the browser. They are part of the document object model (DOM), and so can be associated with actions when the user clicks on them, hovers over them, etc. They are also specified in a way that is independent of display resolution, so they can be printed well and the entire display can be resized without a loss in quality.
Being part of the DOM also has its disadvantages, though: updates require more work and take longer. This is why visualizations using protovis can feel sluggish when they need to update a lot (protovis uses SVG for the actual rendering).
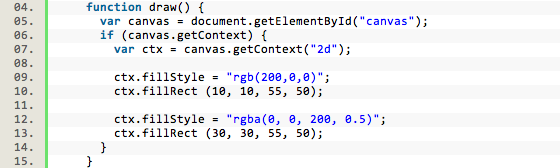
While SVG has been supported for a while in all browsers but Microsoft's Internet Explorer, canvas is relatively new. Canvas provides a framebuffer and a number of functions to draw graphics and text into it. The main difference is that canvas only stores pixels, not objects, so any interaction has to be done separately. But on the other hand, that also means that canvas can be much faster because any programs running in the browser do not modify the DOM.
Because its programming interface is so similar to low-level graphics, browsers have started supporting canvas with hardware-based rendering. In some simple tests, I have found a JavaScript program using canvas to be quite a bit faster than a Java program drawing the same things in Java2D. That is quite remarkable, considering how dynamic and ill-suited for just-in-time compilation JavaScript really is.
JavaScript
The only language that natively runs in the browser is JavaScript. Despite its name, it really is hardly related to Java at all: the name was chosen as a marketing tool when it was released (Java was becoming popular back then). JavaScript is a functional language with a C-like syntax and many weird design choices. Developers who approach it as simply Java in a browser are bound to be frustrated. But once you understand its idiosyncrasies, and learn to stay away from some of its more problematic features, it's actually quite a nice and capable language.
While JavaScript used to be slow for the first decade or so of its existence, the last year or two have brought some amazing advances in speed. Today, JavaScript is compiled into native code in Chrome, Safari, and FireFox, and is easily on par with vm-based languages like Java. There are now even ways to run JavaScript on the server, and it is conceivable that it will become a standard scripting language for many applications soon.
If you are using a smartphone, you may already be using applications written in JavaScript without knowing it. One way to build cross-platform mobile applications is to write them using HTML5 and JavaScript, and then wrap them in a thin layer to make them native applications. What Java set out to do 15 years ago might finally be achieved by JavaScript: write once, run anywhere.
Browser Support
While Internet Explorer doesn't support either SVG nor canvas at the moment, the upcoming IE 9 (to be released around the middle of next year) will have very solid support for HTML5 features and a new state-of-the-art JavaScript engine. This will likely (and hopefully) push a lot of the holdouts to upgrade from the ancient IE6, and encourage businesses to start using these features in production.
Mobile browsers already support SVG and canvas, since they are all based on Webkit (with the exception of the Windows Phone 7 browser). That makes mobile devices the perfect testing platform for these new features, and will make it easy to move them into mainstream production use once the majority of users are using state-of-the-art browsers.
Great, How Do I Get Started?
While there is a lot of information about SVG out there, things are a bit more difficult to find for canvas. Mozilla has a nice, basic tutorial, and Mark Pilgrim covers some additional ground in his online book. Hakim El Hattab has some really impressive game demos.
I am also working on some things involving JavaScript and canvas right now, and will write a tutorial or two on how to use it for visualization.
Comments (3)
Posting new comments was disabled in 2020.