The Repetitive and Boring History of Visualization
When people talk about the history of data visualization, the same set of names always comes up: Playfair, Nightingale, Snow, Minard. They are historically important, alright, but why do they overshadow all the other work that was done? And what do we know about how important they actually were?
The Usual Suspects
They’re like old friends. Every time you see a talk about visualization, one of them will show up. It’s often Minard, but sometimes it’s Nightingale or Snow, and sometimes it’s Playfair. They’re familiar and you kind of expect to see them, but they’re also boring. You’ve seen them, even though you might not know as much about them as you think.
But are those really the examples we should be looking at? What impact did Minard’s chart ever have? Was Nightingale’s plot really that important for making her case for nursing as a profession? I haven’t seen much evidence beyond pure speculation. Snow’s map supposedly was key to convincing the powers that were to shut down that water pump that was spreading the cholera. But were they convinced by the map or by his scientific reasoning?
There are many things we don’t know about these examples, and it seems problematic to just pick them because they have nice stories attached to them. What was their real impact? How much do we know about each of them (and which of those stories are even true)? And what are we missing?
Perhaps there were much more important charts and visual tools out there that are long forgotten, but that affected many more people than what we like to show. To illustrate what I mean, here are three examples that were likely more important than the ones I listed above.
Watt’s Steam Power Indicator
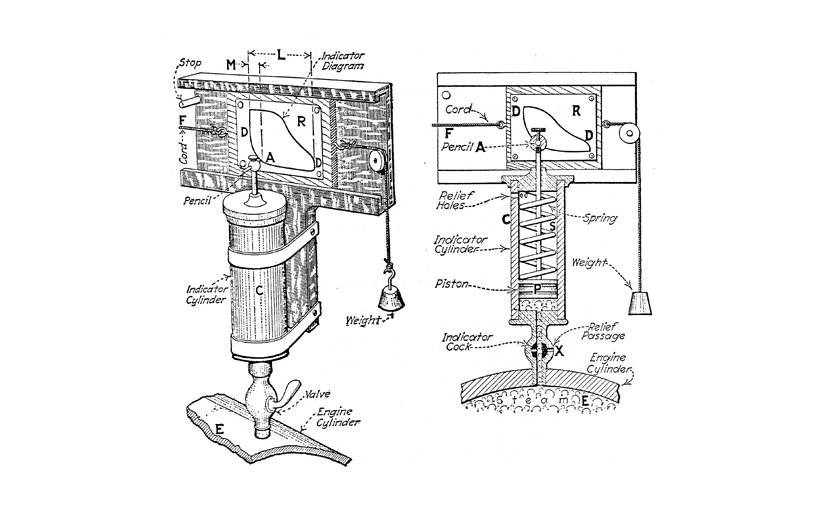
There is some debate about when exactly the first steam indicator drew a chart, but it must have been the early or mid–1790s. These diagrams not only predate nearly all the famous visualization examples, they were also hugely important for the development of the steam engine – and they were drawn by a machine rather than by hand!
James Watt or his engineer John Southern devised this incredible apparatus that could plot the pressure inside a steam engine against the movement of the piston. The area of the diagram represents the amount of power the engine produces, and the shape of different parts described the different elements of the stroke and are useful diagnostic tools.
How important was this diagram? Clearly very important, or Watt wouldn’t have kept it a secret for many years. He was able to glean valuable information from it to optimize his engines and get a leg up on the competition that was quickly springing up.
The steam engine is what brought about the industrial revolution – no steam engine, no industry, no railway, no electricity, etc. It’s not a stretch to say that this diagram played a crucial part in bringing all that about. And yet few people know about it or understand its significance.
The Slave Map
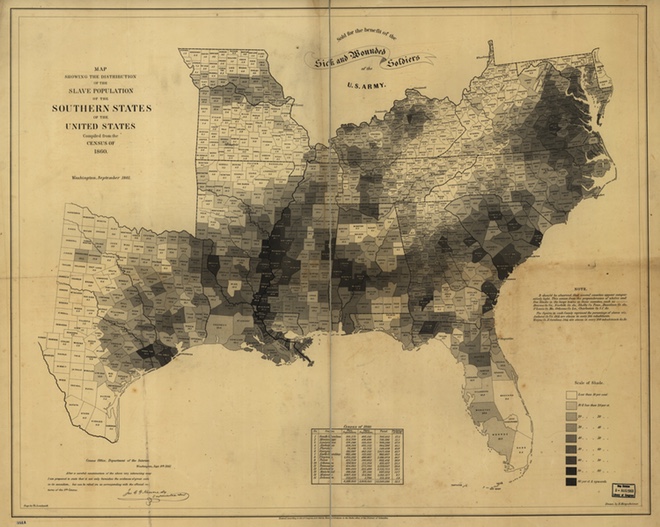
Clive Thompson recently wrote about the history of the information graphic, citing the usual suspects. He also included an example that is remarkably different, though: a map of the slave population in the Southern States of (what is now) the United States, based on the 1860 census.
This wasn’t just a statistical map. It was an early statistical map, for sure. But its impact was that it showed the people fighting the American Civil War whom they were fighting, and what they were fighting for. And in particular, it was a constant reference for Abraham Lincoln. We know that because of historical accounts, and because it was included in a famous painting of Lincoln working on the Emancipation Declaration.
This was no coincidence. A painting isn’t a snapshot that includes whatever clutter might be lying around. Paintings are carefully arranged and staged, and something as complex as this map was not included just for fun. This is visual evidence of this map’s central role in the history of the United States.
And yet, this is not the map that everybody shows in their visualization classes. Why not? Because Minard's map is a better story? Because it's less uncomfortable to talk about a fairly abstract war than about slavery?
ISOTYPE
ISOTYPE is largely ignored in visualization, and yet it seems to have been a major thing in the middle of the last century. There was the ISOTYPE institute that Otto and then Marie Neurath ran for decades. There were also numerous books that used ISOTYPE, beyond the ones that the Neuraths themselves wrote. I know of at least a dozen books on subjects like politics, economics, entertainment, and health that included ISOTYPE charts. The charts were not the main focus of the books, they were used to illustrate the dry numbers and to give people something interesting and memorable to look at.
How much impact did those have? I don’t know. I don’t even think it’s going to be possible to get numbers for print runs in the 1940s or 50s (or even much more recent ones). But these books must have reached a large number of people. There must have been a reason for authors to seek out the ISOTYPE institute to have these charts made.
It’s amazing that we don’t seem to know much about this at all, even though it’s not even that long ago.
What Else Are We Missing?
This list is by no means meant to be complete. Instead, I want to know what else we’re missing. We seem to be content just looking at the same old examples again and again.
If we don’t know enough about their context and real importance, we’re dealing with a very shallow and limited understanding of our history. We’re doing ourselves a huge disservice by ignoring the truly important and impactful pieces. We need to change that.
Posted by Robert Kosara on August 14, 2016. Filed under isotype, history.