
How do we read pie charts? Do they differ from the even more reviled donut charts? What about common pie chart designs like exploded pies? In two papers to be presented at EuroVis next week, Drew Skau and I show that the common wisdom about how we read these charts (by angle) is almost certainly wrong, and that things are much more complicated than we thought.
Pie charts are generally looked down on in visualization, and many people pride themselves on saying mean things about them and the people who use them. This is not a new phenomenon, either. Yet they are incredibly common in business settings and information graphics.
The main reason for these papers was the question: do we even know how we read these charts? Is it actually angle, as is usually claimed, or is it really arc length or maybe area? It turns out that there is no actual research to back up the claims that it's angle. The only paper we could find, and which gets cited over and over again, is from 1926. That's ninety years ago. And the author just asked people what they thought they used, which is quite unreliable.
So we set out to do some science around this. The full paper reports on two studies to assess the mechanism for pie and donut charts. and look at the effect inner diameter has on donuts. For the short paper, we then took some of the things we had found and tested common pie chart variations. Yes, this is the full-plus-short paper package I mentioned a while ago.
Arcs, Angles, or Areas: Individual Data Encodings in Pie and Donut Charts
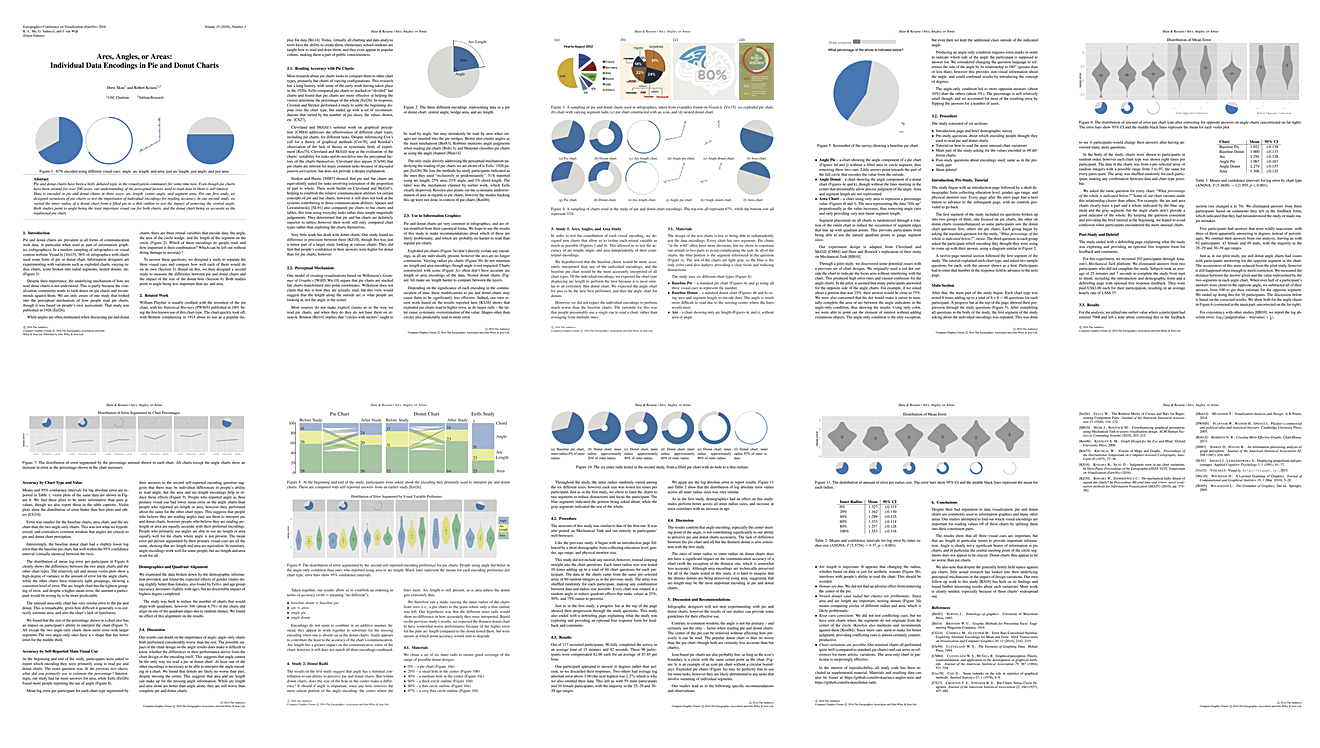
The full paper reports on two studies. One presented participants with deconstructed charts that were designed to test encodings independently from each other. Measuring their accuracy when using any of these variations, we could assess which of them was actually being used, no matter what people claimed.

From left to right, they are: pie, donut, arc-only, angle-only based on pie, angle-only based on donut, and area-only.
The results are quite interesting: the complete pie and donut charts do the best, while the angle-only conditions are the worst. People were surprisingly good with the area-only condition (far right), which was completely unexpected. Arc-only is virtually identical with area-only.
What does this mean? Angle is not likely the main, and certainly not the only, way we read pie charts. This is not only based on the arc-only results, but also the fact that pie and donut charts did not differ in a significant way – donut charts lack the center, so they should make judging angle harder.
We also wanted to see if there was an effect from the inner diameter in donut charts. So we tested a set of donuts with varying hole sizes (with the "no-hole" pie chart serving as a baseline).

There is no difference between them, other than the thinnest donut being worse than the rest (we're not sure exactly why). Donut charts no worse than pie charts! Who knew!?
The paper has a lot more information about the studies and detailed analyses of the results: Drew Skau, Robert Kosara, Arcs, Angles, or Areas: Individual Data Encodings in Pie and Donut Charts, EuroVis 2016.
Code and data are also available, for both the arcs-angles-areas study and for the donut radii study
Judgment Error in Pie Chart Variations

Based on the full paper, we had some predictions for what should happen for specific pie chart variations that we often see in business presentations and information graphics. We ran a further study to test some of those.

Left to right, there's a basic pie chart, a pie chart with a larger slice (often used for emphasis), an exploded pie chart, and two pies with unusual shapes. We designed those to mimic the sort of icon-based pie charts that are fairly common in infographics, where segments are drawn on top of some shape (usually much more complex than the ellipse and square).
The results are quite surprising, certainly if you still think that central angle is how we read pie charts. The larger slice and exploded pie chart don't distort the angle, so we should be able to read them just as accurately as the base pie chart.
And yet, they both led to more error. The larger slice in particular led to a clear and systematic overestimation of the value. The distorted charts, unsurprisingly, did even worse.
If you're after precision, don't distort your pie charts. Certainly don't change their shapes, but also don't explode them or make a slice larger.
Again, the paper has quite a bit more detail and depth: Robert Kosara, Drew Skau,* Judgment Error in Pie Chart Variations*, EuroVis Short Papers 2016. Code and data are also available on github.
So Pie Charts Are Cool?
I don't care if you like or dislike pie charts. I really don't. But visualization wants to be a science, so our supposed rules need to be based on evidence – not hearsay, opinion, or aesthetic judgments.
If we can't trust the common wisdom on pie charts, what can we trust? What other assumptions are unfounded? There are many other areas in visualization where we think we know what's going on, but it hasn't been systematically studied at all. That's still lots of opportunity for truly fundamental research.
Comments (16)
Posting new comments was disabled in 2020.