Story Points
I consider presentation and storytelling the next step in visualization, after most of the focus has been on exploration and analysis so far. An upcoming version of Tableau will include a feature called Story Points, which supports presentation directly in the visualization tool.
A Story
A Tableau Story is a new type of sheet, like a worksheet or a dashboard. It consists of a set of story points, which are worksheets or dashboards in specific states. What that means is that the story point captures the filters, selections, and other things that you can do on a sheet without changing its structure.
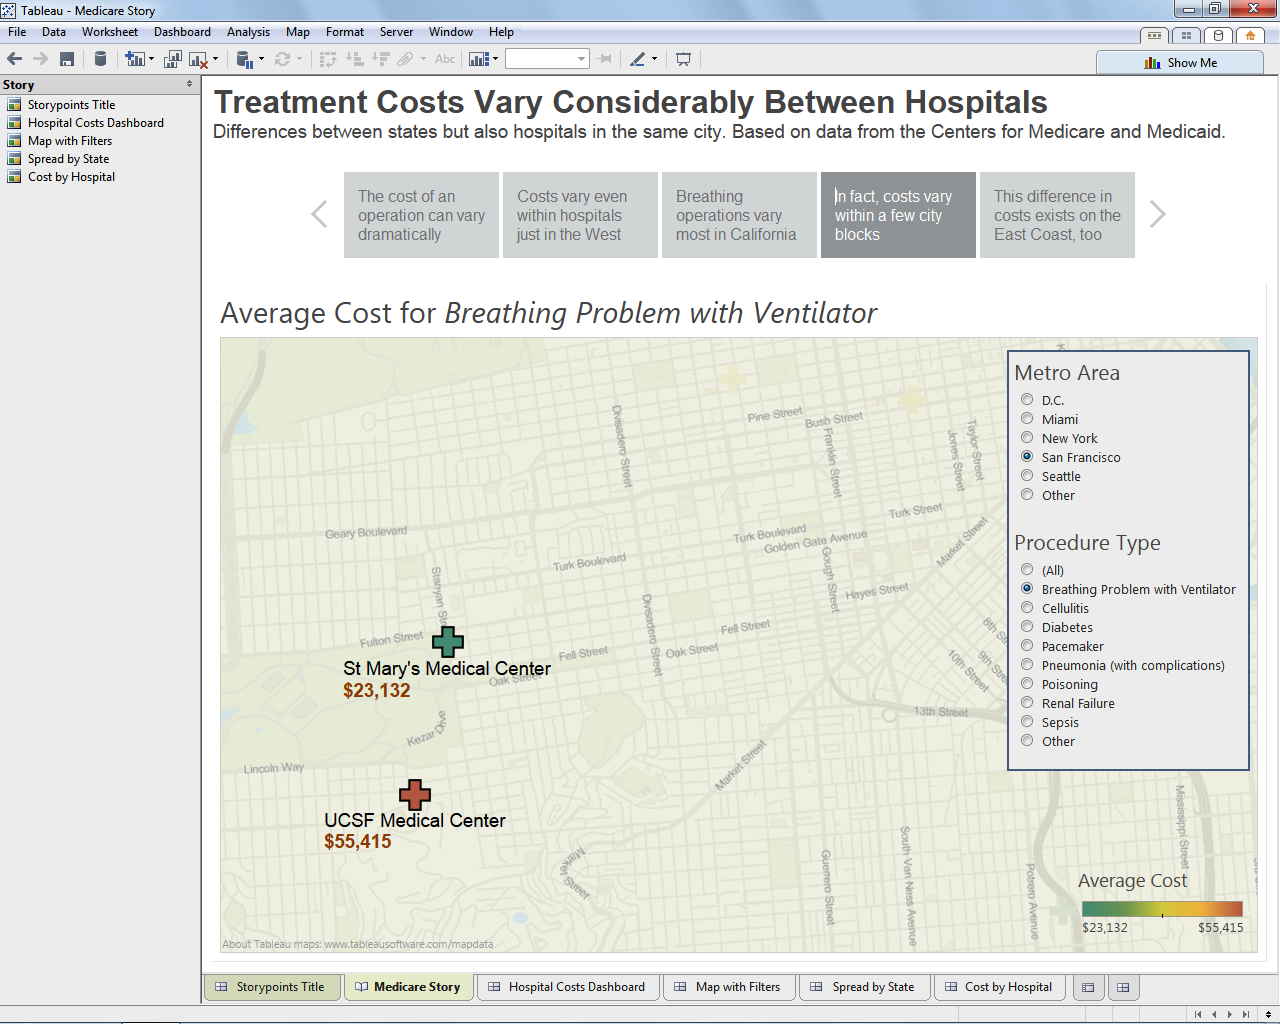
A story point captures a particular point, or insight. The idea being that you can use this to guide somebody through your work to show them what you have found, and maybe even ask questions. That’s the low-key version of a story. The high-key version is then to tie these points together into a compelling narrative, which naturally requires more work.
In addition, each story point has a caption in the navigator you see at the top, and the story has a title (with an optional subtitle).
Story points work well with Tableau’s upcoming presentation mode, which puts the program into full-screen mode and allows you to use it like a presentation tool, while still being fully interactive, to drill down or do other things in response to questions.

Creating Story Points
The user interface is very simple and straightforward, and essentially consists of a single button: Capture. After adding a sheet to the story and making changes, you can capture the current state at any point. You can then continue working and capture another story point at any time (on the same sheet or a different one). Tableau simply remembers what state the sheet was in when you clicked the button.

Don’t need a point, or don’t like the order? Story points can be rearranged by simply dragging and dropping them, and there is a little delete button when you hover over the point in the navigator at the top. The caption for a point can also be changed at any time without needing to capture again.
The way this works is similar to GEDViz, only based on a much more powerful visualization tool. GEDViz and Tableau are actually nice complements, since Tableau doesn’t do network diagrams right now.
Usage Scenarios
Story points are meant to cover all the usage scenarios Jock Mackinlay and I laid out in our storytelling paper earlier this year: presentation in front of an audience or colleagues, as well as people clicking through a prepared set of points on a web site.
In addition, they will undoubtedly be useful to provide an introduction to people you send a workbook to. It can be hard to get started with new data, so including a little guided tour through the most important points should be very useful to get somebody started.
When story points are released in Tableau 8.2 early next year, they will be available in Tableau Public as well (and of course Tableau Server and Tableau Online). This will make it possible for anybody to create stories from data and publish them, interaction and all, without the need to write a single line of code.
Reception
What surprised me when I demoed the feature at TCC was the response from corporate users. I thought that some might like it, but that many would be skeptical about what they would do with this. But it turns out that presentation is a real pain point. Many people export images from Tableau to PowerPoint for presentation, but then of course can’t interact with those in their presentations. Having the actual program running means you can answer questions right there.
https://twitter.com/JonBoeckenstedt/status/377147325346750464
It was pretty cool to get this amount of applause for such a new and different feature. In fact, story points were second only to the revealing of the Mac version in terms of audience response – and that was kind of an unfair competition.
https://twitter.com/KatieBlye/status/377146203496267776
https://twitter.com/eleanorpd/status/377146027356082176
If you want to see a demo of story points, check out the TCC keynote video and jump to 1:41:50 for my part.
Posted by Robert Kosara on October 6, 2013. Filed under Tableau, storytelling.