Quo Vadis, Many Eyes?
Remember when visualization for the masses was all the rage, back in 2007? We were so young and hopeful. Many Eyes and Swivel were the harbingers of a new age of data literacy and well-informed debate. Visualization was going to be social and change the world. Alas, it was not to last. Swivel is gone, and Many Eyes clearly seen its best days. This is despite the fact that interest in visualization is growing, and it turns out that Many Eyes is as busy now as never before. I have scraped some data from the site that shows that despite the lack of updates and new features, people's use of it is still increasing. The data also gives some interesting insights into what people use it for.
Signs of Decline
What got me interested in doing this was my perception that there had not been anything new from Many Eyes in a while. The site's founders, Martin Wattenberg and Fernanda Viégas, left about three years. First they started their own venture, then they joined Google. Other members of the Visual Communication Lab (VCL) left in short order: Frank van Ham went back to Europe about two years ago, and Adam Perer left late last year (he is still listed on the IBM-external VCL webpage (update: this is now a spam site, link removed), but his LinkedIn page is more up-to-date).
It's fairly clear that IBM has no interest anymore in Many Eyes, at least in its public-facing incarnation. The move, about two years ago, to an almost comically bad URL was a strong sign. I don't think I've seen a URL like this in the last ten years or more, it's a sight to behold:
That is the front page, not some internal path. I don't know who made this decision, or based on what thinking, but it doesn't make sense in any way. This doesn't work as advertising for Cognos, if that was their intention, it just makes them look silly (though Cognos seems to have a thing for ridiculous URLs in general). Anybody can point a domain to a subdirectory, but big, mighty IBM can't? Seriously?
The VCL's external website also speaks volumes about the how important the group was to IBM. It seems that they have been entirely absorbed now into IBM's Center for Social Business. When they started, I criticized Many Eyes's lack of a business model; it looks like IBM finally decided that they didn't see one in the future, either.
Scraping the Site
I can't say that scraping the data was easy, but Many Eyes at least provides easy ways to enumerate all the datasets and visualizations and slowly work through them. There are a number of pitfalls and issues, such as the fact that there are two entirely different URLs for each dataset, but all the data is there, and it's fairly easy to get.
The data is partly available because I am using Tableau Public for the embedded visualizations. It is rolled up to the day level though, so I could stay under the 100,000 row limit. My scraper was also unable to get some of the datasets and visualizations, and I want to add those before releasing the entire data collection. The missing datasets make up much less than 1% though, so they do not influence the discussion here in any meaningful way.
You can download the workbooks and partial datasets from the little toolbars on each of the embedded views below. I will release the entire dataset once I've added the missing bits and done a bit of clean-up.
A Look At the Data
I had expected to find that use of Many Eyes had increased from its start in early 2007 to around 2010, and then dropped off slowly. Interestingly, that is not the case. By use, I mean people uploading data and creating visualizations, not page views or embeddings (which I don't have data for). While it wouldn't have surprised me to see lots of people to still ending up on the site for one reason or another, the amount of new things that are being made is quite staggering.

Looking into the much noisier week-level data, one can see some interesting patterns. There is a clear dip around Christmas, with a somewhat less obvious dip about a month earlier (Thanksgiving). While these are expected (the Thanksgiving dip says that a large portion of users are American), the dip in late August is less so. There are also some interesting spikes up, often around early May for some reason.
Looking a bit more closely at 2011, despite the spikes in both directions the year was actually fairly flat. It looks like the site is at a plateau, or close to it, and will likely have fewer new visualizations and datasets in 2012 than it did in 2011.

The comparative view above is a bit misleading, because scale on the vertical axis is different between the parts. The number of visualizations is quite a bit lower than the number of datasets: there are about 2.5 times more datasets than there are visualizations.

There seems to be a fairly straight-forward reason for this, though that may not tell the whole story. Uploading datasets on Many Eyes is easy, but it is also error-prone. It appears that people have to retry several times before they get it right; a lot of dataset names end in numbers that the system seems to add when it has already seen a name. There also apparently is no way to delete datasets, so the unsuccessful attempts stay on the site forever.
More surprisingly, though, it appears that this was less of a problem early on. When looking at the distribution of visualizations per dataset, that number started at over 1 and then slowly declined to the current value of about 0.4. This view again shows weekly data, where the initials spike is clearly visible.

Not only are people making mistakes, the lack of collaboration on the site means that few people pick up others' datasets to create visualizations from, which would increase the number of visualizations per dataset. The idea of social data visualization was that somebody would dig up some data, and then many people could easily create visualizations from it. That isn't happening on Many Eyes, though. As I was developing my scraper, I saw several copies of Obama's State of the Union speech appear. The people who were uploading it apparently never checked if that data was already there, but just uploaded their own version. The result is that the majority of datasets that has any visualizations at all has exactly one. Datasets with more than one view on them are quite rare, while a clear majority of datasets has no views at all.

A community needs leadership and nurturing, and Martin and Fernanda did a lot of that in Many Eyes' early days. That is quite visible when looking at the distribution of the number of visualizations per dataset over time. The gray area at the top of the next view are the datasets without any visualizations, the stacked areas are increasing numbers of views (1 to 6, from the bottom). While the upper layers are clearly visible in the first few months, the decline in social engagement over time is very obvious, settling at about 70% of datasets with no views, 25% with one view, and the remaining 5% being split up among two and more views.

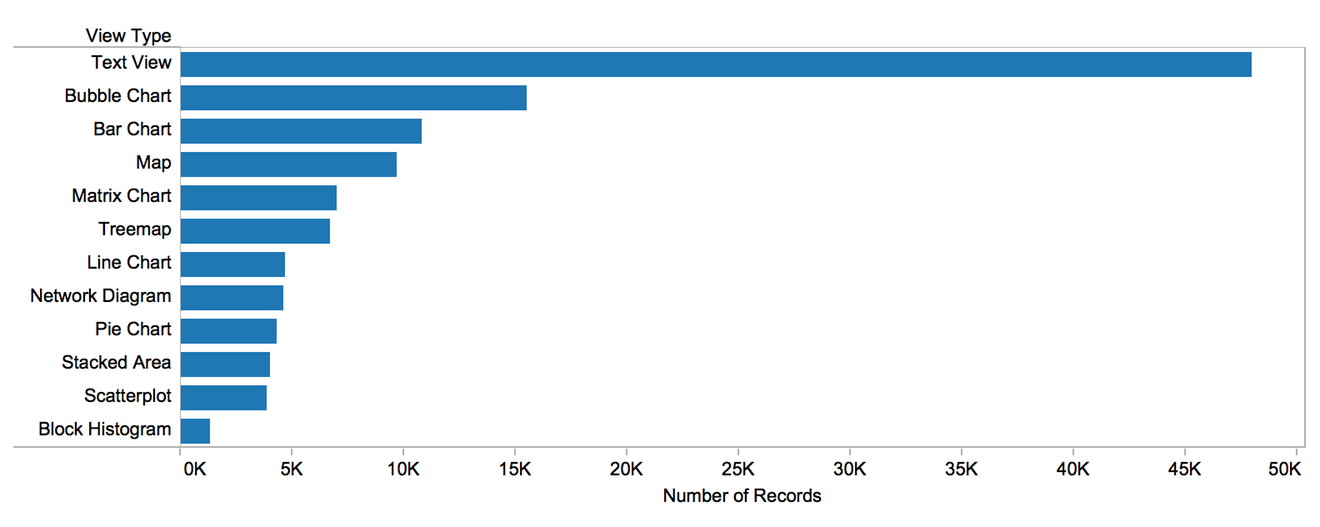
What do people use Many Eyes for? Looking at the types of visualizations shows some interesting patterns. The most common views, by far, are the various text views. That is quite interesting, since there are few good visualization tools for text. Of those that exist, though, a good part can be found on Many Eyes. Their phrase nets and word trees are unique and quite effective. Looking at numerical data displays, the bubble chart and bar chart are the most common. It is remarkable that matrix charts and treemaps are more popular than line charts – though I guess line charts are easy to make in lots of programs (so are bar charts, though).
Digging a little deeper into the text views, the clear winner here is the very attractive wordle. That it is so popular on Many Eyes is still remarkable though, since it has its own website where people can create their own wordles as well.

In summary, it appears that Many Eyes has succeeded in some of its goals and not in others. While it was a pioneer in the social aspects, the datasets are a big mess and there is nowhere near the level of collaboration that there could be. What has worked well, though, and attracted a lot of attention are the unique text views. I can't help but think that there's a lesson to be learned here somewhere.
What Lies Ahead?
At this point, Many Eyes is essentially an empty shell that just keeps going because nobody has bothered to shut it down. It would take a major reboot for IBM to revive it at this point, since all the original members of the VCL and, frankly, all the people with any credibility in visualization, are gone. Experiments like Many Bills are nice, but they don't have anywhere near the scope and potential that Many Eyes had.
At the same time, though, there is clearly demand for accessible, powerful visualization on the web. And with ever more data becoming available, the need for better and more accessible ways of communicating it will only grow. The spirit of Many Eyes is still very much alive, even if the site is not.
In the interest of full disclosure, I should add that I am currently doing my sabbatical at Tableau Software. This posting was not written to poo-poo the competition, however.
Posted by Robert Kosara on February 26, 2012. Filed under many-eyes, criticism.