A Protovis Primer, Part 1
Protovis is a very powerful visualization toolkit. Part of what makes it special is that it is written in JavaScript and runs in the browser without the need for any plugins. Its clever use of JavaScript's language features makes it very elegant, but it can also be confusing to people who are not familiar with functional programming concepts and the finer points of JavaScript. This multi-part tutorial shows how to create a visualization (my interactive Presidents Chart) in Protovis, and explains the concepts that are involved along the way.
This introduction is based on my experiences with using Protovis in my Visualization and Visual Communication class earlier this spring. While the concepts involved are really not that difficult, they are rather foreign to students who have not been exposed to functional programming. And since that is also the case for a lot of hobbyists and people wanting to do visualization who do not have a computer science background, I imagine they run into the same problems.
This has grown from being a single article into several parts (and is still expanding). Let me know if there are things that you don't understand or that you think need to be covered in more detail, so I can tailor the next parts accordingly.
Protovis requires a modern browser, which means any recent version of Safari, Chrome, FireFox, or Opera. Internet Explorer does not work, because it does not support the HTML5 Canvas element. The visualizations in this article are all Protovis drawings (check out the source code!), with a fall-back to images for RSS readers and IE users. There is no real difference at this point, but once we get to interaction, you will want to read this in a supported browser.
A Simple Example
Let's start with a simple example, taken almost verbatim from the Protovis paper presented at InfoVis 2009 (PDF).
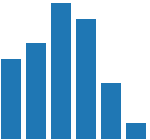
The following code creates this chart:
var vis = new pv.Panel().width(150).height(140)
    .add(pv.Bar)
        .data([1, 1.2, 1.7, 1.5, .7, .2])
        .bottom(0).width(20)
        .height(function(d) d * 80)
        .left(function() this.index * 25)
    .root.render();
Let's look at this line by line. The first line defines a new Panel, the base element for any Protovis chart. The panel is the canvas on which everything is drawn (in fact, it becomes an actual canvas element in the webpage). This line also defines its size by calling two functions that set its width and height.
Function Chaining
This brings us to the first bit of magic: Almost all functions in Protovis return the object they are called on. That makes it possible to chain function calls instead of having to repeat the variable name over and over. While this leads to more elegant, simpler code, it can make it a bit terse and more challenging to read. But consider the alternative:
var vis = new pv.Panel();
vis.width(150);
vis.height(140);
var bar = vis.add(pv.Bar)
etc ...
Function chaining lets you treat functions like statements: I want a panel, and I want its width to be 150 and its height to be 140; this translates very directly into function calls. While this is not all there is to what Bostock and Heer call a “declarative style of programming,” it certainly is a big part of it.
Marks
But back to our example. The second line adds something to the panel by calling the add() function. What is added is called a mark, a graphical element that can represent data. Let's briefly skip over the details of that and look at the last line: here, we need to call the render function of the panel to tell it to create the necessary infrastructure and start rendering. Since at this point, the functions being called are called on the bar mark that was added in the second line, we need a way to go back to the panel. This could be done by assigning the panel to a variable vis and calling vis.render(). The way it is done here is using the special variable root, which exists in all marks. It returns the panel that the mark sits on, so we can add other marks to it or call its functions.
The following code snippet is identical to the above. I just showed the other one first because it is the style that the Protovis examples are written in, so it makes sense to get familiar with it.
var vis = new pv.Panel().width(150).height(140);
vis.add(pv.Bar)
    .data([1, 1.2, 1.7, 1.5, .7, .2])
    .bottom(0).width(20)
    .height(function(d) d * 80)
    .left(function() this.index * 25);
vis.render();
Using variables is a good idea in general, especially when creating more complex visualizations. But the clever design of Protovis' functions makes it possible to all but eliminate them in many cases (at least as far as Protovis objects are concerned).
Mark Properties
Now let's look at the definition of the bars, which is the same between both alternatives. The first statement defines an array of numbers, which are the data to be shown on the chart. We will later see data in variables and arrays of objects, not just numbers. But this kind of inline definition of the data is also possible. The square brackets delimit an array in JavaScript (and lots of other programming languages), numbers are listed with commas in between.
The line after the data statement specifies two important but constant parts of the layout. Since we're using bars, we have to specify at least their position (x and y), their width, and height. For a bar chart, it makes sense to have all the bars have the same width, so it is set to a number here. And since we want all bars to sit on the same baseline, we specify their y position as 0. The terminology here, bottom, has to do with the way locations and sizes can be specified in Protovis. I'll cover more of that later.
More Fun With Functions
The next two lines is where it gets really interesting, and where a lot of confusion comes from. Remember that we are creating a bar chart here, but there is no loop to draw each of the bars. We specified the entire data array two lines earlier. Now how do we get Protovis to draw something?
The way Protovis works is that a definition like this tells it to iterate over the array of data it is given, instantiate a mark for each entry in the array, and evaluate all the information it is given about what to do with the mark. In the case of the width and bottom attributes, this is simple: we specified constants, so it just uses these same numbers for all of the bars it creates.
But we want the bars to represent the data by varying their height, how do we do that? The answer here is a function. Instead of specifying a number or variable, we assign a function to the height property. For every entry in the array, Protovis will call this function with the value, and use the result of the function as the height of the bar. The beauty of this approach is that JavaScript, unlike Java and most of the more common imperative languages, can use a function like a variable: you can pass it to another function, store it in a variable, and evaluate it by calling it.
As with the function chaining before, the particular style in which this is done in Protovis makes this a bit more difficult to understand. Here is the definition of the height again:
.height(function(d) d * 80)And here is the same definition in a more verbose style that is actually correct JavaScript (Protovis does some magic with function parsing that allows the sloppy but more compact style above):
.height(function(d) {
    return d * 80;
})
Both statements do the exact same thing: they specify a function without a name (called an anonymous function) that takes one argument called d. The function returns the result of a simple computation, multiplying the value of that argument by 80. The unit here is pixels, which means that our highest bar will be 1.7 * 80 pixels high (1.7 is the maximum value in the data array).
Functions used in property definitions can do a lot more complex things. You can also assign functions to variables and reuse them in different definitions. But many functions used in visualization definitions in Protovis perform fairly straight-forward calculations or access data in more complex data structures (we'll get to that, too).
The last line in the bar definition works the same way as the height definition, with a small difference. We want our bars to be next to each other, not drawn on top of each other. Even though the mark is called bar, it is really more a general-purpose rectangle: it doesn't know anything about being a bar in a bar chart. That makes it very flexible and powerful, but it also means that you need to do a lot of things by hand that might seem obvious.
Bar Layout
To move the bars, we specify their left property, which together with the bottom means we're specifying the lower left corner. Since this value will have to be different between the bars, we need to again specify a function. We are specifying everything at once, so there is no obvious way to order the bars and use that order to space them. Protovis therefore has a special variable that is available when it evaluates functions, which is called this.index. That variable's value is the index of the current value in the array, starting at 0 and going all the way to the size of the array minus 1.
.left(function() this.index * 25);Remember that we set the width of the bars to 20. Putting the bars at multiples of 25 means that we're leaving five pixels of space between them. You can easily tweak any of these numbers to change spacing, scaling, etc. Just remember that when you increase the scale factor, you will have to also change the size of the panel, or your bars will be cut off!
Adding A Variable
The last step in this first part of this tutorial is simply to move the data into a variable. This is a simple but important step. To do this, we will define new variable numbers that contains the exact same numbers as above. The only other thing that changes is the data() function call that now uses the variable.
var numbers = [1, 1.2, 1.7, 1.5, .7, .2];

new pv.Panel().width(150).height(140)
    .add(pv.Bar)
        .data(numbers)
        .bottom(0).width(20)
        .height(function(d) d * 80)
        .left(function() this.index * 25)
    .root.render();
Running this does not actually make any difference, which is what we intended. But it opens the doors to some more flexibility. What if we wanted the bars to change size depending on how much data there is? Let's define another variable for the panel, panelWidth, and calculate the width of the bars, barWidth, from the size of the array.
var panelWidth = 150;

var barWidth = panelWidth/numbers.length;
The barWidth is the total space a bar takes up, including its spacing to the next bar. If we simply use this for our definition:
new pv.Panel().width(panelWidth).height(140)
.add(pv.Bar)
.data(numbers)
.bottom(0).width(barWidth)
.height(function(d) d * 80)
.left(function() this.index * barWidth)
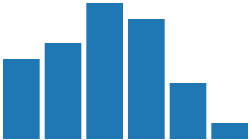
.root.render();We end up with something slightly unexpected:

We need to add some space between the bars again. Remember that we set the width to 20 earlier, but multiplied the index by 25. We need something similar here, so we'll introduce another variable, barSpacing. This will be subtracted from the barWidth in the width definition, so the bar does not use the entire width it got assigned.
var barSpacing = 5;

new pv.Panel().width(panelWidth).height(140)
    .add(pv.Bar)
        .data(numbers)
        .bottom(0).width(barWidth-barSpacing)
        .height(function(d) d * 80)
        .left(function() this.index * barWidth)
    .root.render();
The result is a readable chart that looks like before:
This may not look very exciting, but it gives us a lot of flexibility. Now we can change the width of the chart by simply changing the panelWidth, let's say to 250:
As you can see, the bars have adapted to the new width. The spacing looks a bit odd because barSpacing is still a constant, but that would be easy to change, too. But what happens if we add more data to our numbers array?
var numbers = [1, 1.2, 1.7, 1.5, .7, .2, .5, .9];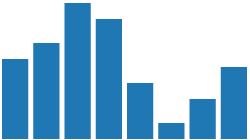
The bars adapt to the number of values, because the barWidth depends on the number of values in the numbers array, numbers.length. This only works to a certain point, because our spacing is still constant; but it's a start.
This concludes the first part of this tutorial. The next parts will cover more complex layouts, Protovis scales, other mark types, reading of complex data, labels, etc.
Start Playing!
If you want to play with Protovis, I am providing a ZIP file with two simple HTML files: one is the basic bar chart, the other one uses variables for the data and the widths.
I have also started a repository on github for people familiar with git.
Next:
Posted by Robert Kosara on June 2, 2010. Filed under tutorials.