Bar charts are great. They always work. They're always the safe choice. Right? Well, no. Stacked bar charts are deceiving because we think they work just like regular bars, when they're really pretty terrible.
Some Examples
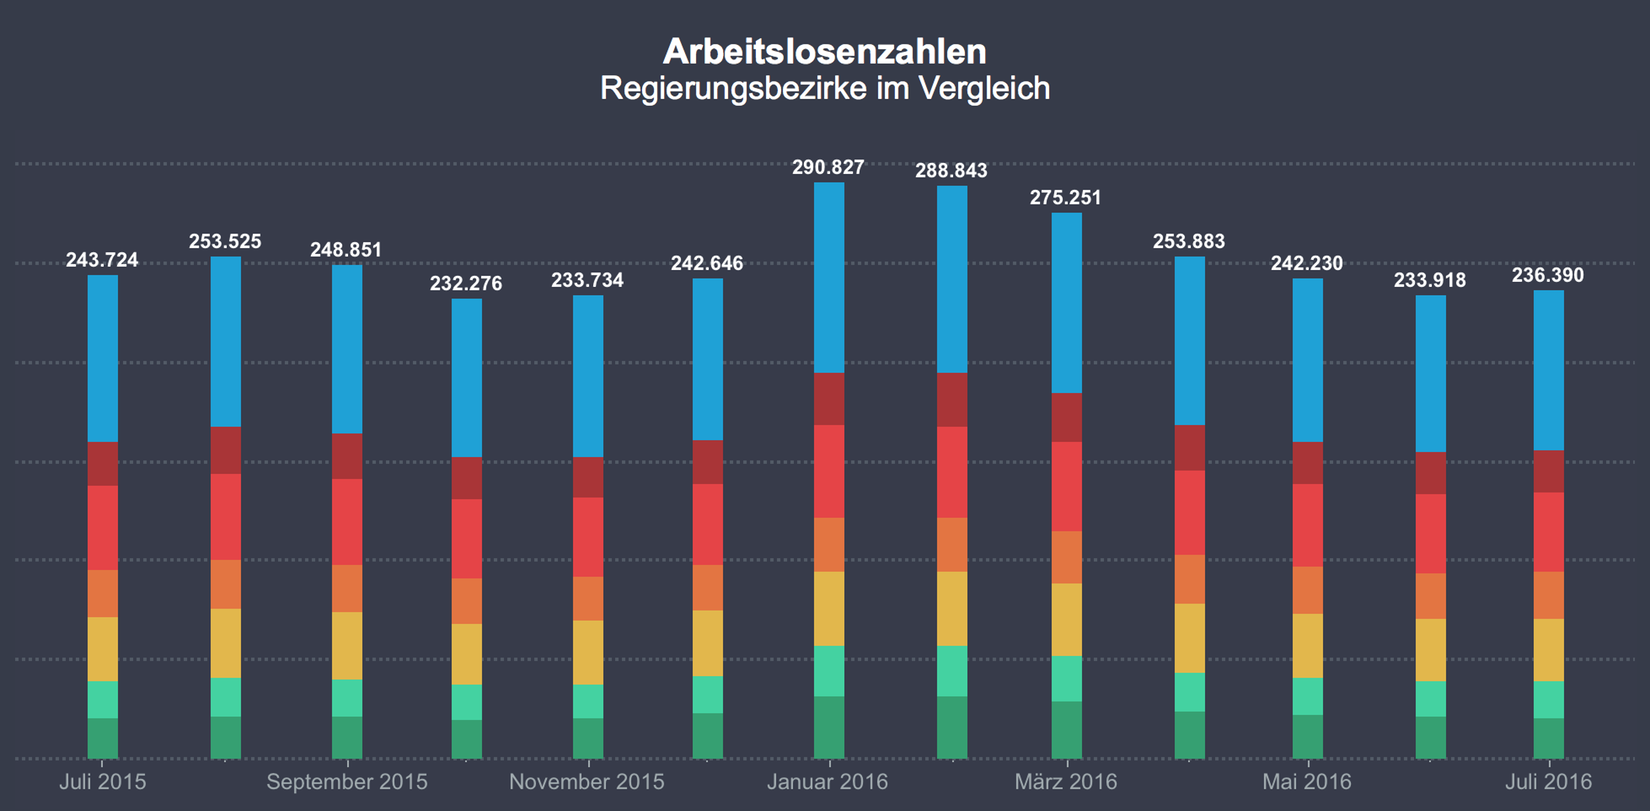
Look at the following chart, showing unemployment numbers for Bavaria. The total height of the bars is easy enough to compare, but how about the blue bars at the top? Are those getting longer or shorter? How sure are you?
Wikipedia has the following chart comparing pie and bar charts, which is used in teaching visualization to show how bad pie charts are. Compare the green segment in the pie charts and the bar charts. Clearly, pie charts are much more difficult to read.

But is the comparison fair? The bars are next to each other, they're easy to compare. Stacked bars are actually much more like pie charts.
The Obligatory Cleveland and McGill Section
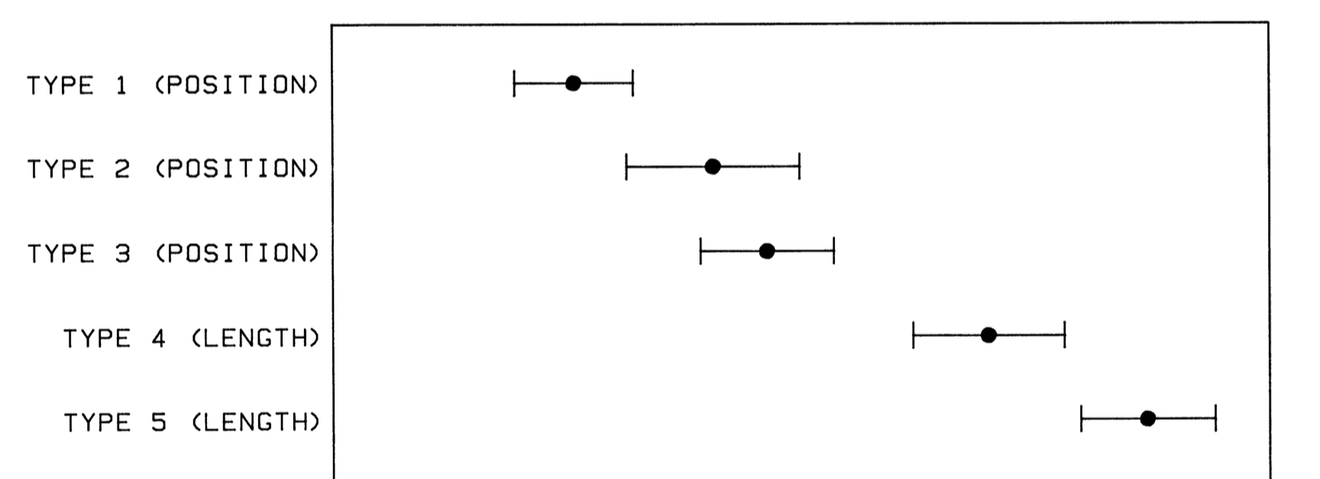
While this doesn't seem to be widely known, it's not new. In their seminal paper on graphical perception, Cleveland and McGill compared stacked bars with other ways of doing bar charts. Here are the five kinds of bar configurations they compared.

The little dots indicate what to compare. Types 4 and 5 are the stacked bar charts. Type 4 is similar to my example above, where you're looking at bars that sit on top of other bars. In Type 5, you're comparing lengths that are stacked rather than next to each other. The results show that these are the most difficult, producing the highest error.
Here are confidence intervals (same thing I've used in the recent pie charts postings) for error. Check out types 4 and 5!
The latter are clearly worse than the first three. The confidence intervals clearly don't overlap. The error metric used in the paper is also based on the logarithm, so the differences here are pretty large.
But Cleveland and McGill also tested pie charts. Let's see how pie charts do in comparison. I've highlighted them in the full version of the results.
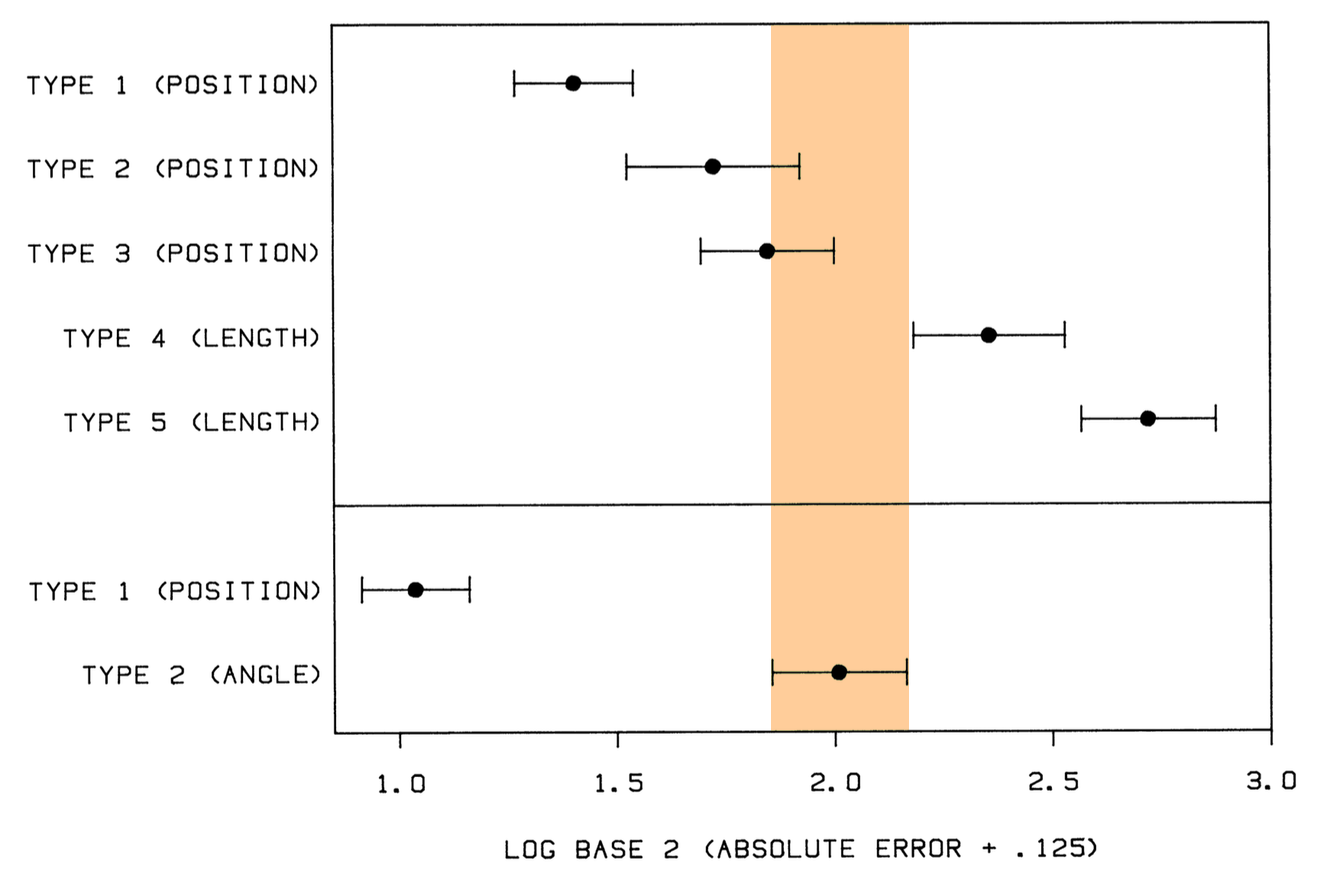
Stacked bar charts have higher error than pie charts (angle condition, even though we now know that it's not angle)! The basic bar charts are clearly better than pie charts, but stack them and they're worse! Both stacked configurations are worse than pie charts, but especially the one where you're comparing bars that sit on top of each other.
There are also other studies that have found the same or similar results. One example is the Mechanical Turk study on square pies I wrote about recently.
It's Not That Simple
Nobody ever got fired for using a bar chart, right? Well, it's not quite that easy. Even though many charts seem really simple, making small changes to them can have a significant impact on their readability.
There is also more to it than just the chart type. If the differences in the values are large, you'll be able to tell which way things are going even if you can't read the values with much precision. Depending on the use case, that can be good enough. But when the numbers are similar or there is no clear trend, they get harder to see and you need a more robust way of showing the data.
Stacked bars are particularly problematic because they have the air of precision, when they're really poor. They can be useful when the point is to show that a value is the sum of other values, but you're only interested in comparing the totals. They also work if you only need to show one section and can make that the one on the bottom. Then the bars are comparable and work well.
But just throwing values into a stacked bar chart is a bad idea. Just like people tend to misuse pie charts, most uses of stacked bars I see are really poorly done. People don't pick up on that even when they will immediately ridicule you for using a pie chart. Things are a bit more subtle than bar chart good, pie chart bad, however.
Comments (19)
Posting new comments was disabled in 2020.