Paper: Privacy-Preserving Visualization
The point of visualization is usually to reveal as much of the structure of a dataset as possible. But what if the data is sensitive or proprietary, and the person doing the analysis is not supposed to be able to know everything about it? In a paper to be presented next week at InfoVis, my Ph.D. student Aritra Dasgupta and I describe the issues involved in privacy-preserving visualization, and propose a variation of parallel coordinates that controls the amount of information shown to the user.
Naive Approaches
As with everything else, there is an obvious solution to this problem that doesn’t work. We started out by looking at the data mining literature, where preserving privacy has been an issue for a while. After running a dataset through an algorithm called k-members clustering, and adapting parallel coordinates to be able to show clusters instead of lines, we ended up with this:
While this is obviously useless for visualization, this is the way the data can be passed on to third parties without knowledge about what they are going to do with it, while guaranteeing a minimum level of privacy.
A Visualization Solution
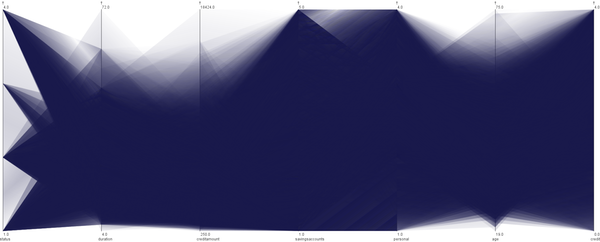
But what if we know a bit more? In this case, what if we know that the user will be looking at the data as a parallel coordinates-like visualization, the axis order in the visualization, and the size of the display? In that case, we can do a bit better:

The key to this is realizing what the user can learn about the data from the visualization, and using that to guide the clustering. Traditional clusters break down the data space, but we cluster in visual space: we get different clusters between each pair of axes. We also use a different distance metric to figure out which clusters are best, again based on visual criteria rather than data space. Finally, we use the distribution of values to help keep clusters small while keeping the number of values per cluster the same (which is the key criterion for guaranteeing privacy).
The result is much fuzzier than regular parallel coordinates, but that is of course the point. At the same time, we keep the utility of the resulting visualization much higher than just using a standard clustering approach. This is a very tough problem in data mining, because even very weak privacy guarantees make the data all but useless. With our technique, we believe that we can keep the utility much higher while still guaranteeing the same level of privacy.
The key to all this is approaching the problem from a visual point of view, rather than from the data. I believe that there is a lot more work to be done not only in privacy preservation, but also more generally in figuring out how to make many existing data mining and other techniques work in a more visualization-centric way.
Aritra Dasgupta, Robert Kosara, Adaptive Privacy-Preserving Visualization Using Parallel Coordinates, Transactions on Visualization and Computer Graphics (Proceedings InfoVis), 2011.
The paper will be presented in the very first InfoVis session on Wednesday, October 26, 8:30-10:00am.
Posted by Robert Kosara on October 16, 2011. Filed under VisWeek, papers.