Chart Junk Considered Useful After All
There is almost universal agreement that any extraneous elements in a chart or visualization, elements that do not represent numbers, are detrimental to understanding the data. A paper that was presented at CHI recently described a study to figure out just how bad all this chart junk really was. As it turns out, it's actually rather helpful.
Chart Junk
The term chart junk was coined by Edward Tufte, who considers anything in a chart that does not represent data (or is a scale or label) as not just unnecessary, but harmful. A related term is the data-to-ink ratio, which is a term to describe how many visual items (how much "ink") representing data there are in a chart in relation to how much there is overall. The idea is to keep that ratio as high as possible, thereby producing very minimalist-looking charts that focus entirely on the data.
Holmes, the Anti-Tufte
The authors of the paper refer to Nigel Holmes, whom visualization people might remember from his fantastic capstone presentation at InfoVis 2005. They quote Holmes as saying that a data graphic "must engage the reader‘s interest." Holmes' way of doing that is through explanatory embellishments. All the charts they used in the study consequently came from one of his books.
The Study
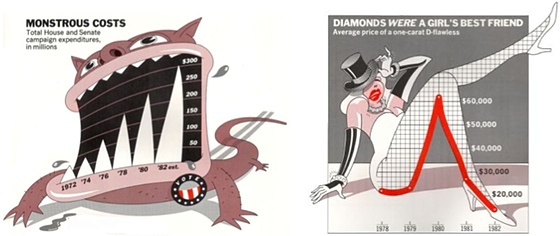
Quick show of hands: which chart is better, this one:
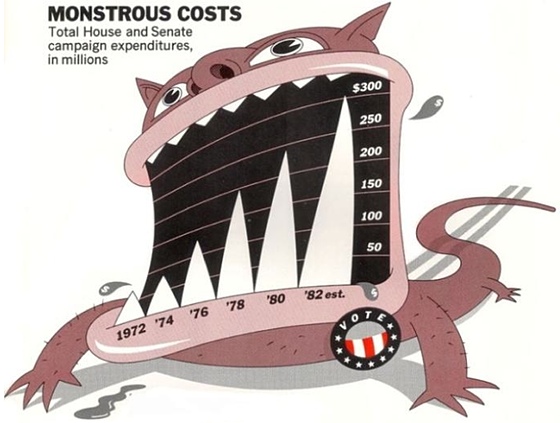
Or this one:

If you subscribe to the Tufte school of thinking, the first chart probably made you cringe. But imagine somebody who just looks at this chart on a newspaper page for a few seconds before reading another article. Which chart is more likely to get its message across?
The study consisted of two possible recall tasks, one five minutes after being shown the charts, and one two to three weeks later. The authors found that in both cases, participants had a significantly higher chance of getting the message of the chart in the case of the highly embellished Holmes-style chart. And while there were no significant differences in recalling the subject, categories, and trend between the two chart types after five minutes, all three were significantly better for Holmes-style charts in the long-term case.
The paper also presents some results from eye tracking, but I find those rather inconclusive due to the somewhat arbitrary dual coding of some areas as data and embellishment (rather than either one or the other). Unsurprisingly, study participants preferred Holmes-type charts as being more attractive, more enjoyable, easier to remember, etc.
While there have been other studies on small design variations, this one really went all out to find some of the most outrageous charts to compare. That makes this work very relevant, because these are the things that we tend to criticize as containing a lot of chart junk.

This study was not about reading and remembering exact numbers; the authors were only concerned with understanding the elements of the chart (what time span, what kind of data, etc.), the trend, and the message. This is a good assumption when dealing with communication-style charts as they are used in newspapers and on most websites, but not for data analysis. That explains why issues like curved or tilted baselines and similar distortions were not such an issue; the overall trend would still be visible even if the values could not be very precisely identified.
But for the purpose of communicating data, obviously the main concerns are getting the point across and making people remember it over a longer time period. Both were clearly done better by the more graphical charts.
Conclusions
This is great work, and the paper deserves the Best Paper Award it received. It's this kind of work that questions basic assumptions and helps us push the field forward.
Does this mean we need to abandon the idea of minimalist junk-less visualizations? Certainly not for analysis tasks, but we do need to rethink how we go about presentation of information.
Also note that this has nothing to do with the kind of work I criticized in the Cargo Cult article: even the most outrageous of these examples clearly represent data that can be read (if not very precisely).
But this clearly calls into question the role of "pure" visualization in communicating issues, and may require a rethinking of how this particular goal can be achieved more effectively.
Scott Bateman, Regan L. Mandryk, Carl Gutwin, Aaron Genest, David McDine, Christopher Brooks, Useful Junk? The Effects of Visual Embellishment on Comprehension and Memorability of Charts. ACM Conference on Human Factors in Computing Systems (CHI), 2010.
Posted by Robert Kosara on April 22, 2010. Filed under criticism.