I've always been fascinated by photos with long exposure times. Your typical snapshot or phone pic essentially captures an instant in time. But extend the exposure, and water turns to glass, cars turn into light streaks, and people disappear. An extreme version of this is the solargraph, which shows the path the sun takes over weeks or months.
Solargraphs are really weird and interesting, and the more you think about them, the stranger they get. They're taken with analog pinhole cameras. There's no shutter. There's no lens. You don't even develop the paper, the image just appears on it. But that also makes these images incredibly transient, and they get ruined by the light you need to scan it. And yet, they are strangely beautiful.
The role of the pinhole
Months-long exposures aren't normally possible with regular cameras. With pinhole cameras, though, they happen almost naturally. The basic pinhole camera is simply a light-tight container with a small hole on one side and some sort of light sensitive medium on the other. Compared to a regular lens, a pinhole tends to let in only a tiny fraction of the light. Simple pinhole cameras also often use photographic paper rather than film, which is much less sensitive again.
The result is that these cameras require long exposure times even for regular shots. Cameras using film typically need a few seconds of exposure even in bright conditions, and can get into minutes or even hours when it's darker. From there, it's not that big a leap to just keep exposing the image for days, weeks, or months.
Fragile latent images
When light hits photographic paper or film, it creates a latent image. This image is usually not visible to the naked eye, and needs a development process and chemicals to be amplified and stabilized. Adding more light, like by taking the exposed film out of a camera and looking at it, would destroy it.
When a lot of light hits film or paper, the latent image becomes much stronger and can be seen directly without development. You can't do this with film anyway, since it would fog and darken very quickly. But photographic paper is less sensitive, so it is possible to take it out and quickly scan or photograph it before it degrades. The light used to take that picture (or the light source in the scanner) simultaneously makes the image visible and contributes to its destruction.
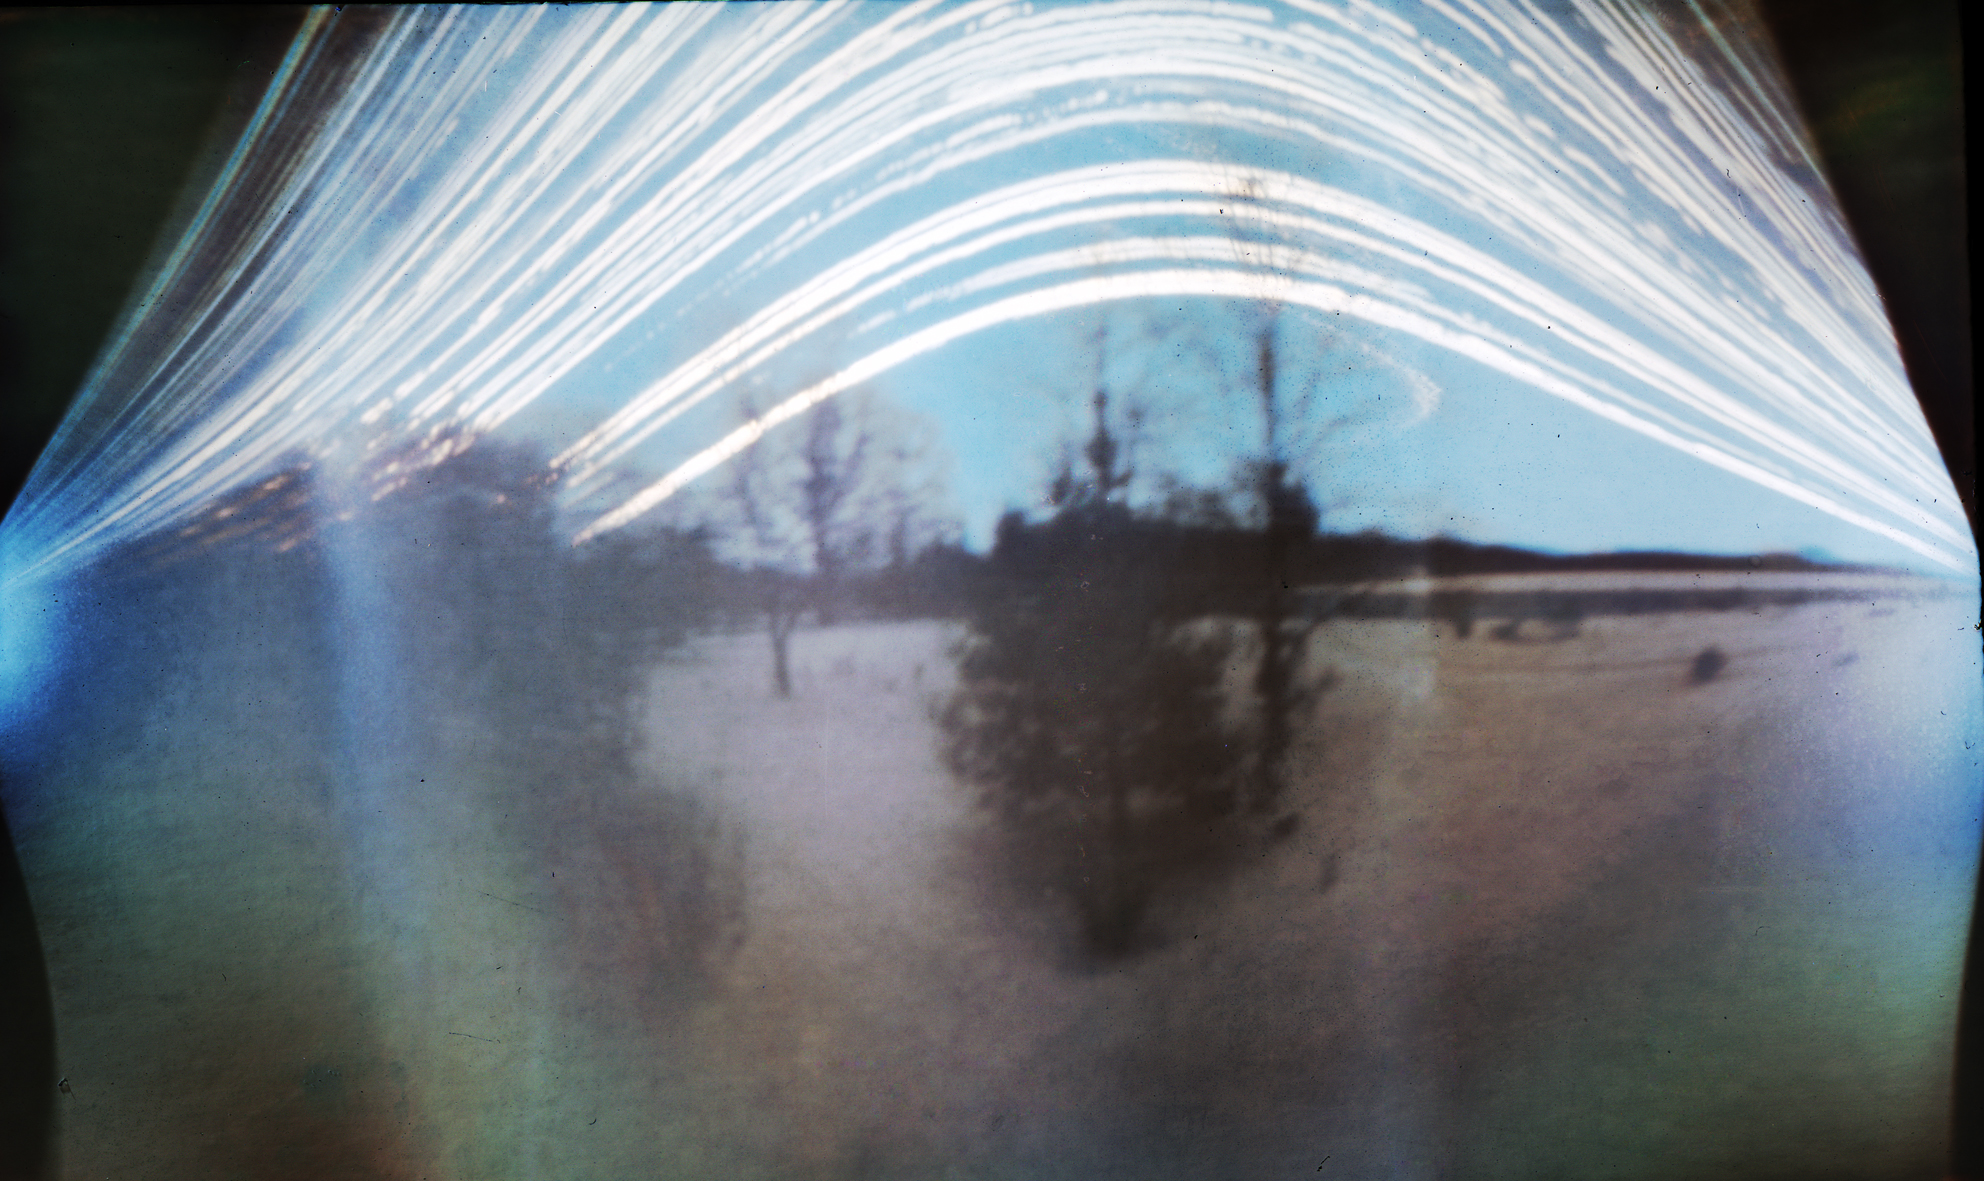
The image on the paper is a negative, like in the top part of this image:
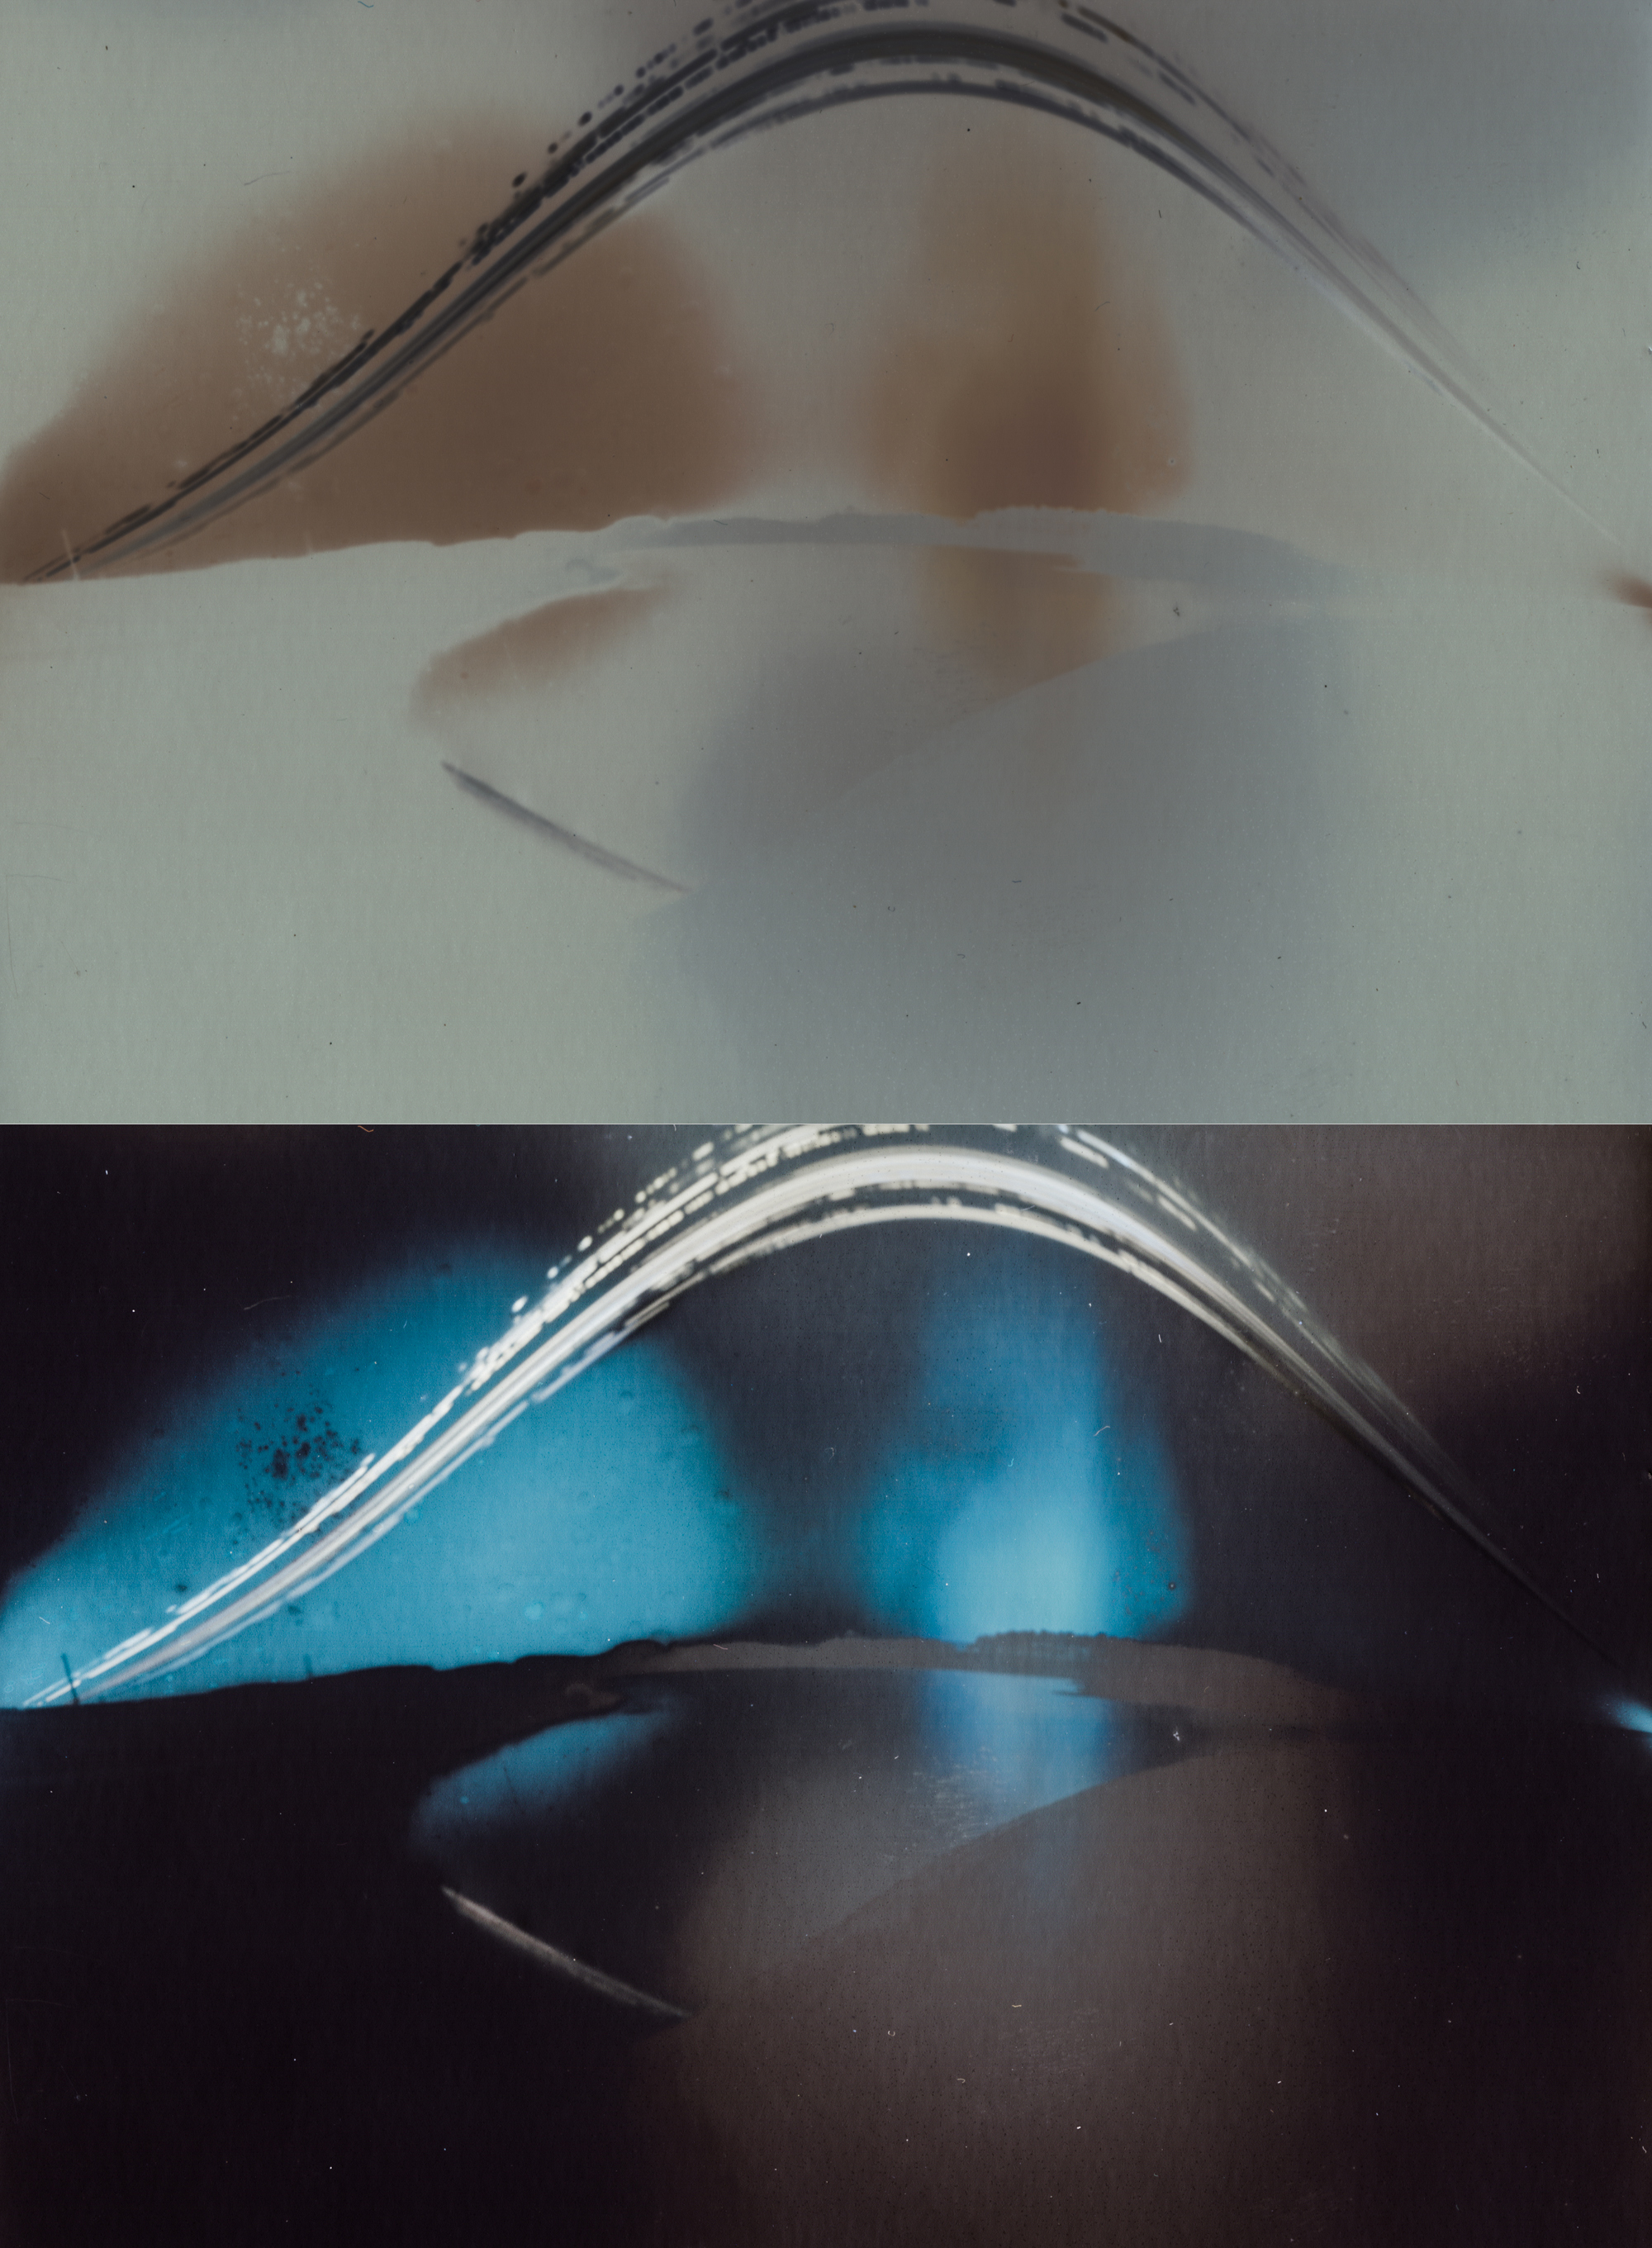
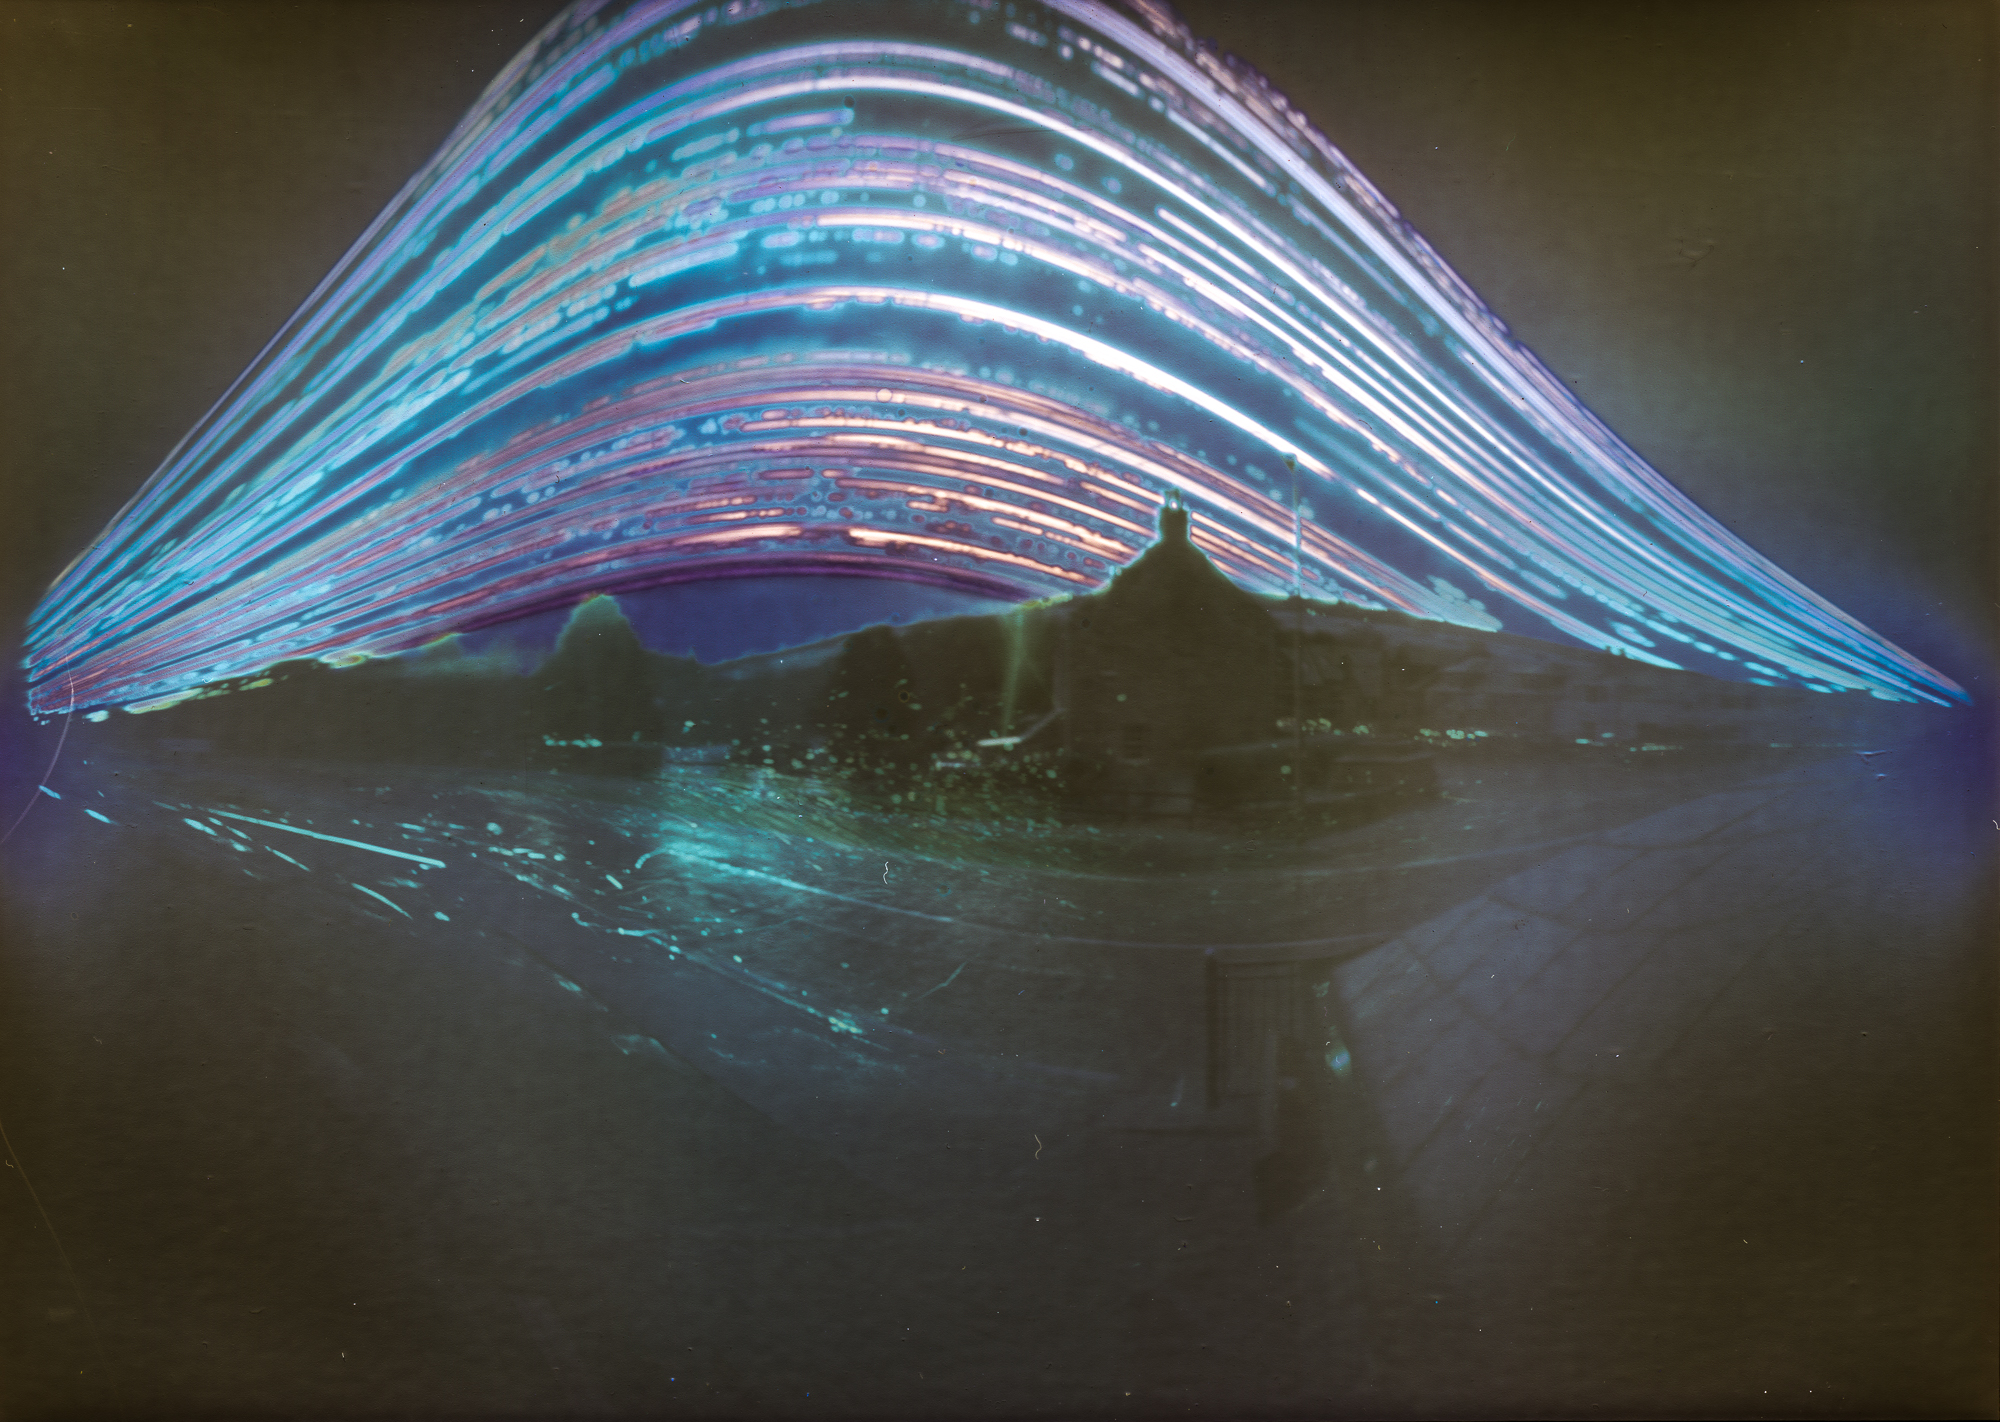
It needs to be inverted to make sense, and usually the contrast needs to be increased considerably. This contrast increase also exaggerates differences in color, which contributes to the often psychedelic colors in solargraphs.
Cylindrical views
We're all familiar with the fact that the sun rises in the east, moves through the south, and sets in the west (in the northern hemisphere, anyway). But this actually gets more complicated than most people realize. In many locations, the sun actually rises in the northeast and sets in the northwest in the summer, sweeping through well over 180º. In Seattle, for example, it's about 250º. This is also where at least my intuition fails again, because the sweep gets larger as you go north (around 300º in Juneau, Alaska, for example), until you get to the latitudes where the sun doesn't even set in the summer and just sweeps through 360º.
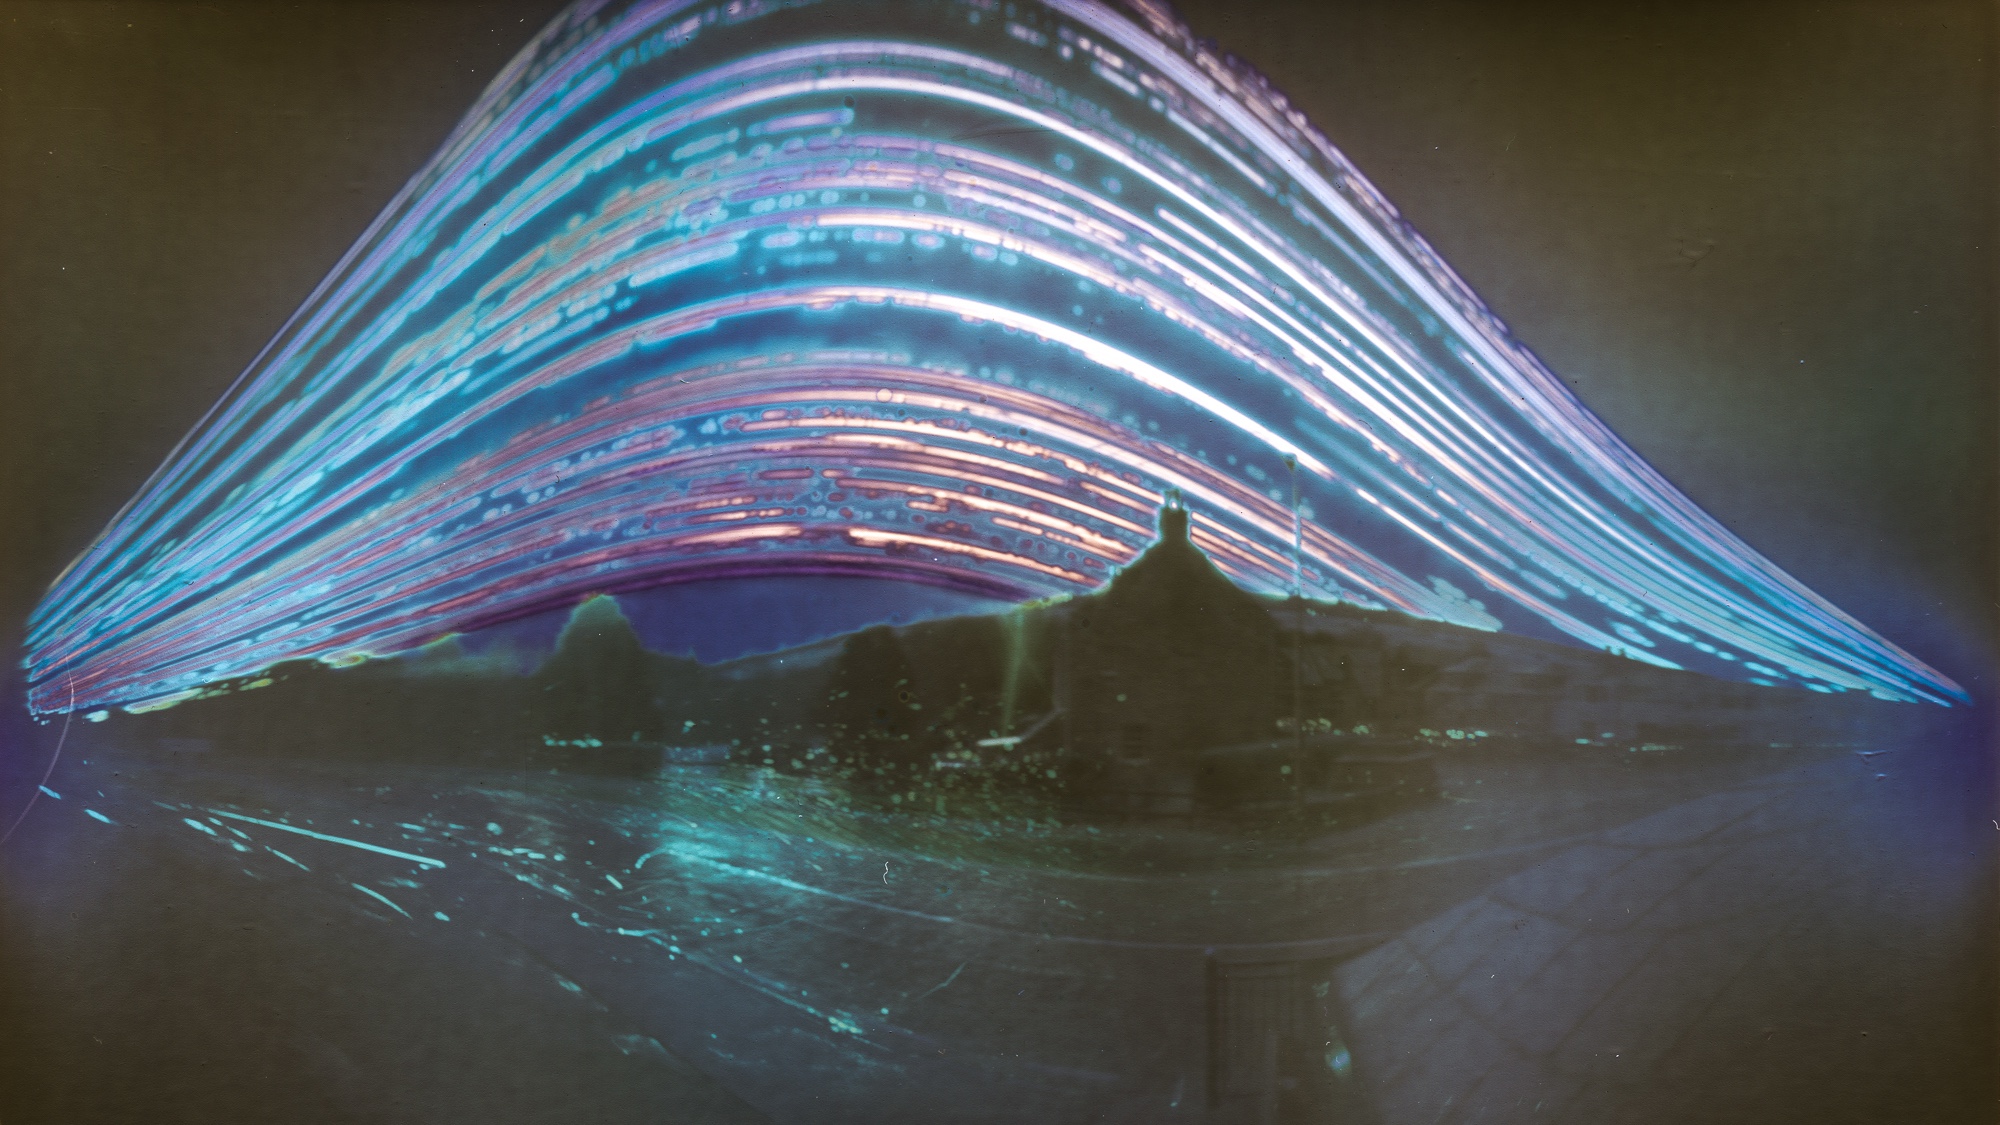
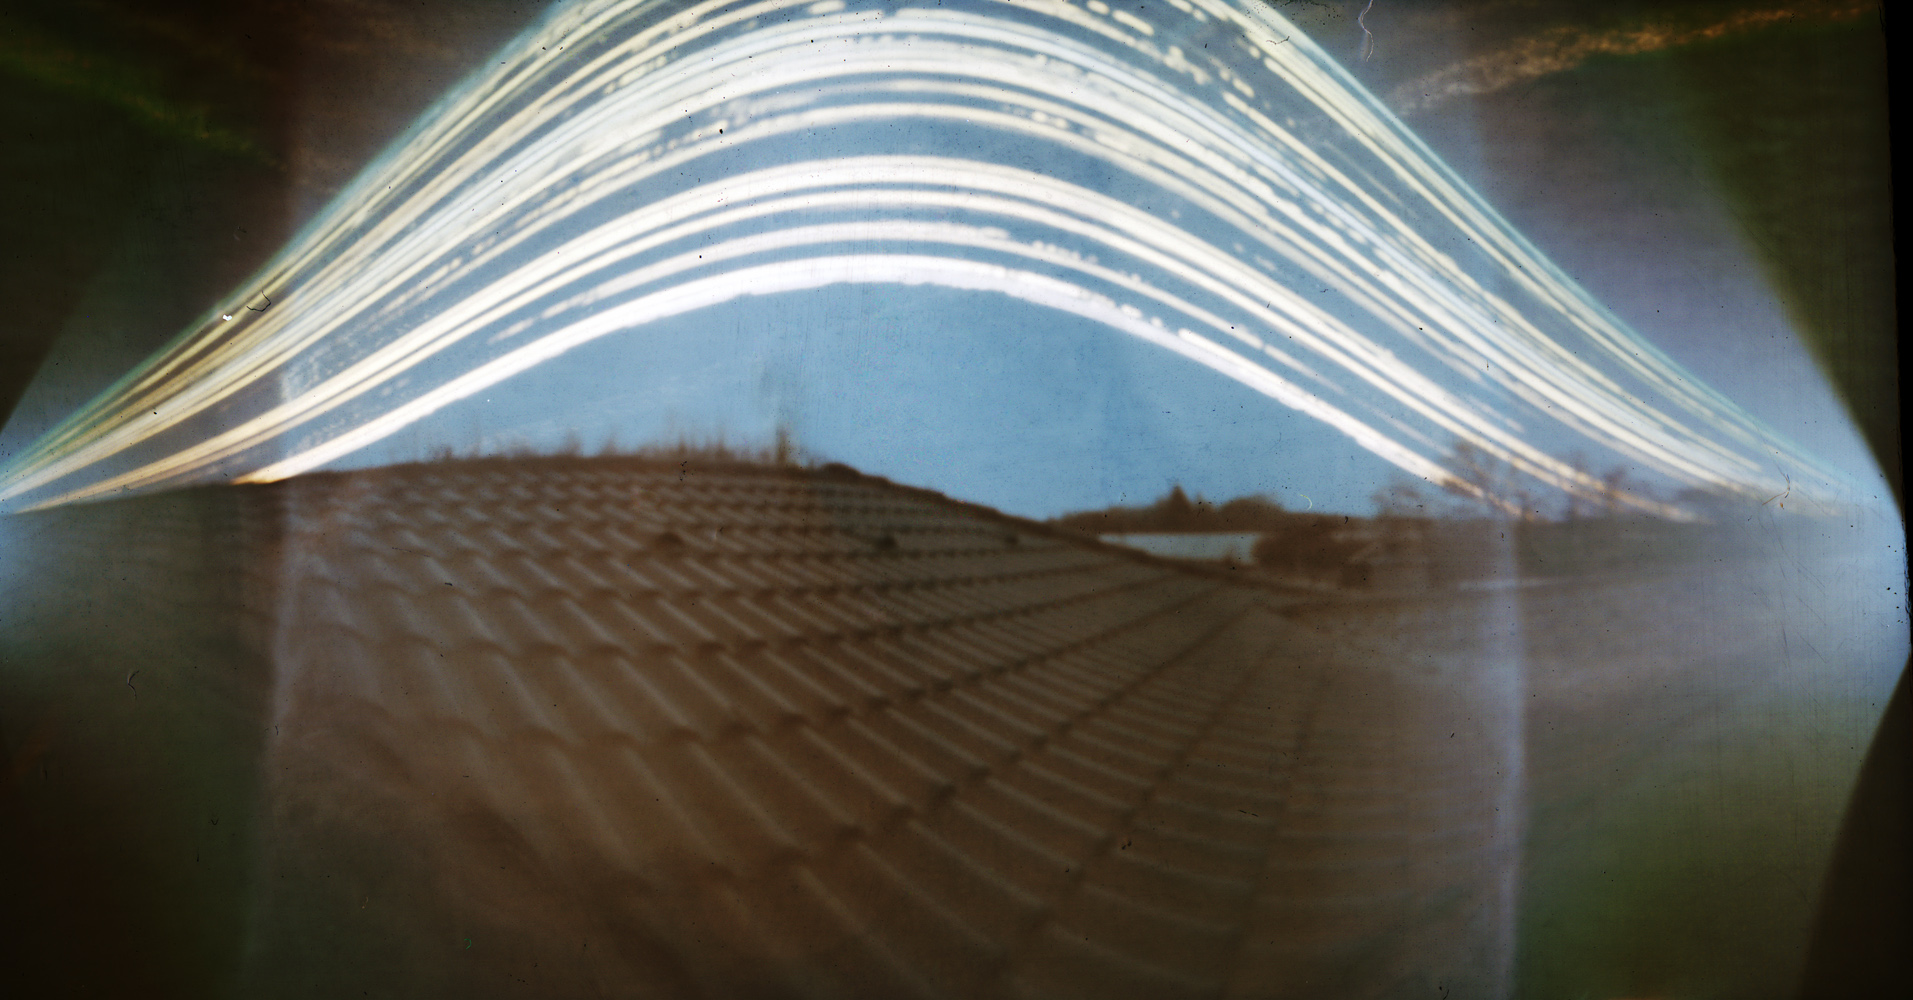
But even just capturing 180º or thereabouts isn't an easy thing to do. So a lot of solargraph cameras are made from round tins or cans of some sort (you can even buy them ready-made, like the Solarcan). This curves the paper horizontally, creating a cylindrical projection of the world.
That's the reason for that distinctive look of many of these images, where the sun's path looks kind of like a mountain rather than the more circular shape you might expect.
Reciprocity failure
Another contribution to the look of solargraphs is the long exposure itself. For most normal conditions, film and photographic paper obey a reciprocity law. It says exposure equals intensity times time: halve the light, double the time, get the same result.
This doesn't hold when very little light reaches the film or paper though, as is the case with solargraph pinhole cameras. The sun is extremely bright and leaves a clear mark on the paper, but the rest of the world doesn't. It gets projected onto the paper as a comparatively very dim image, which the paper only barely responds to.
The result is that the darker areas get crushed in comparison to the sun, and of course any motion in trees will blur out any details over time. The different colors in color paper also don't respond the same under these conditions, which leads to interesting color shifts. All this gives these images an odd, ethereal quality.
A self-illustrating phenomenon
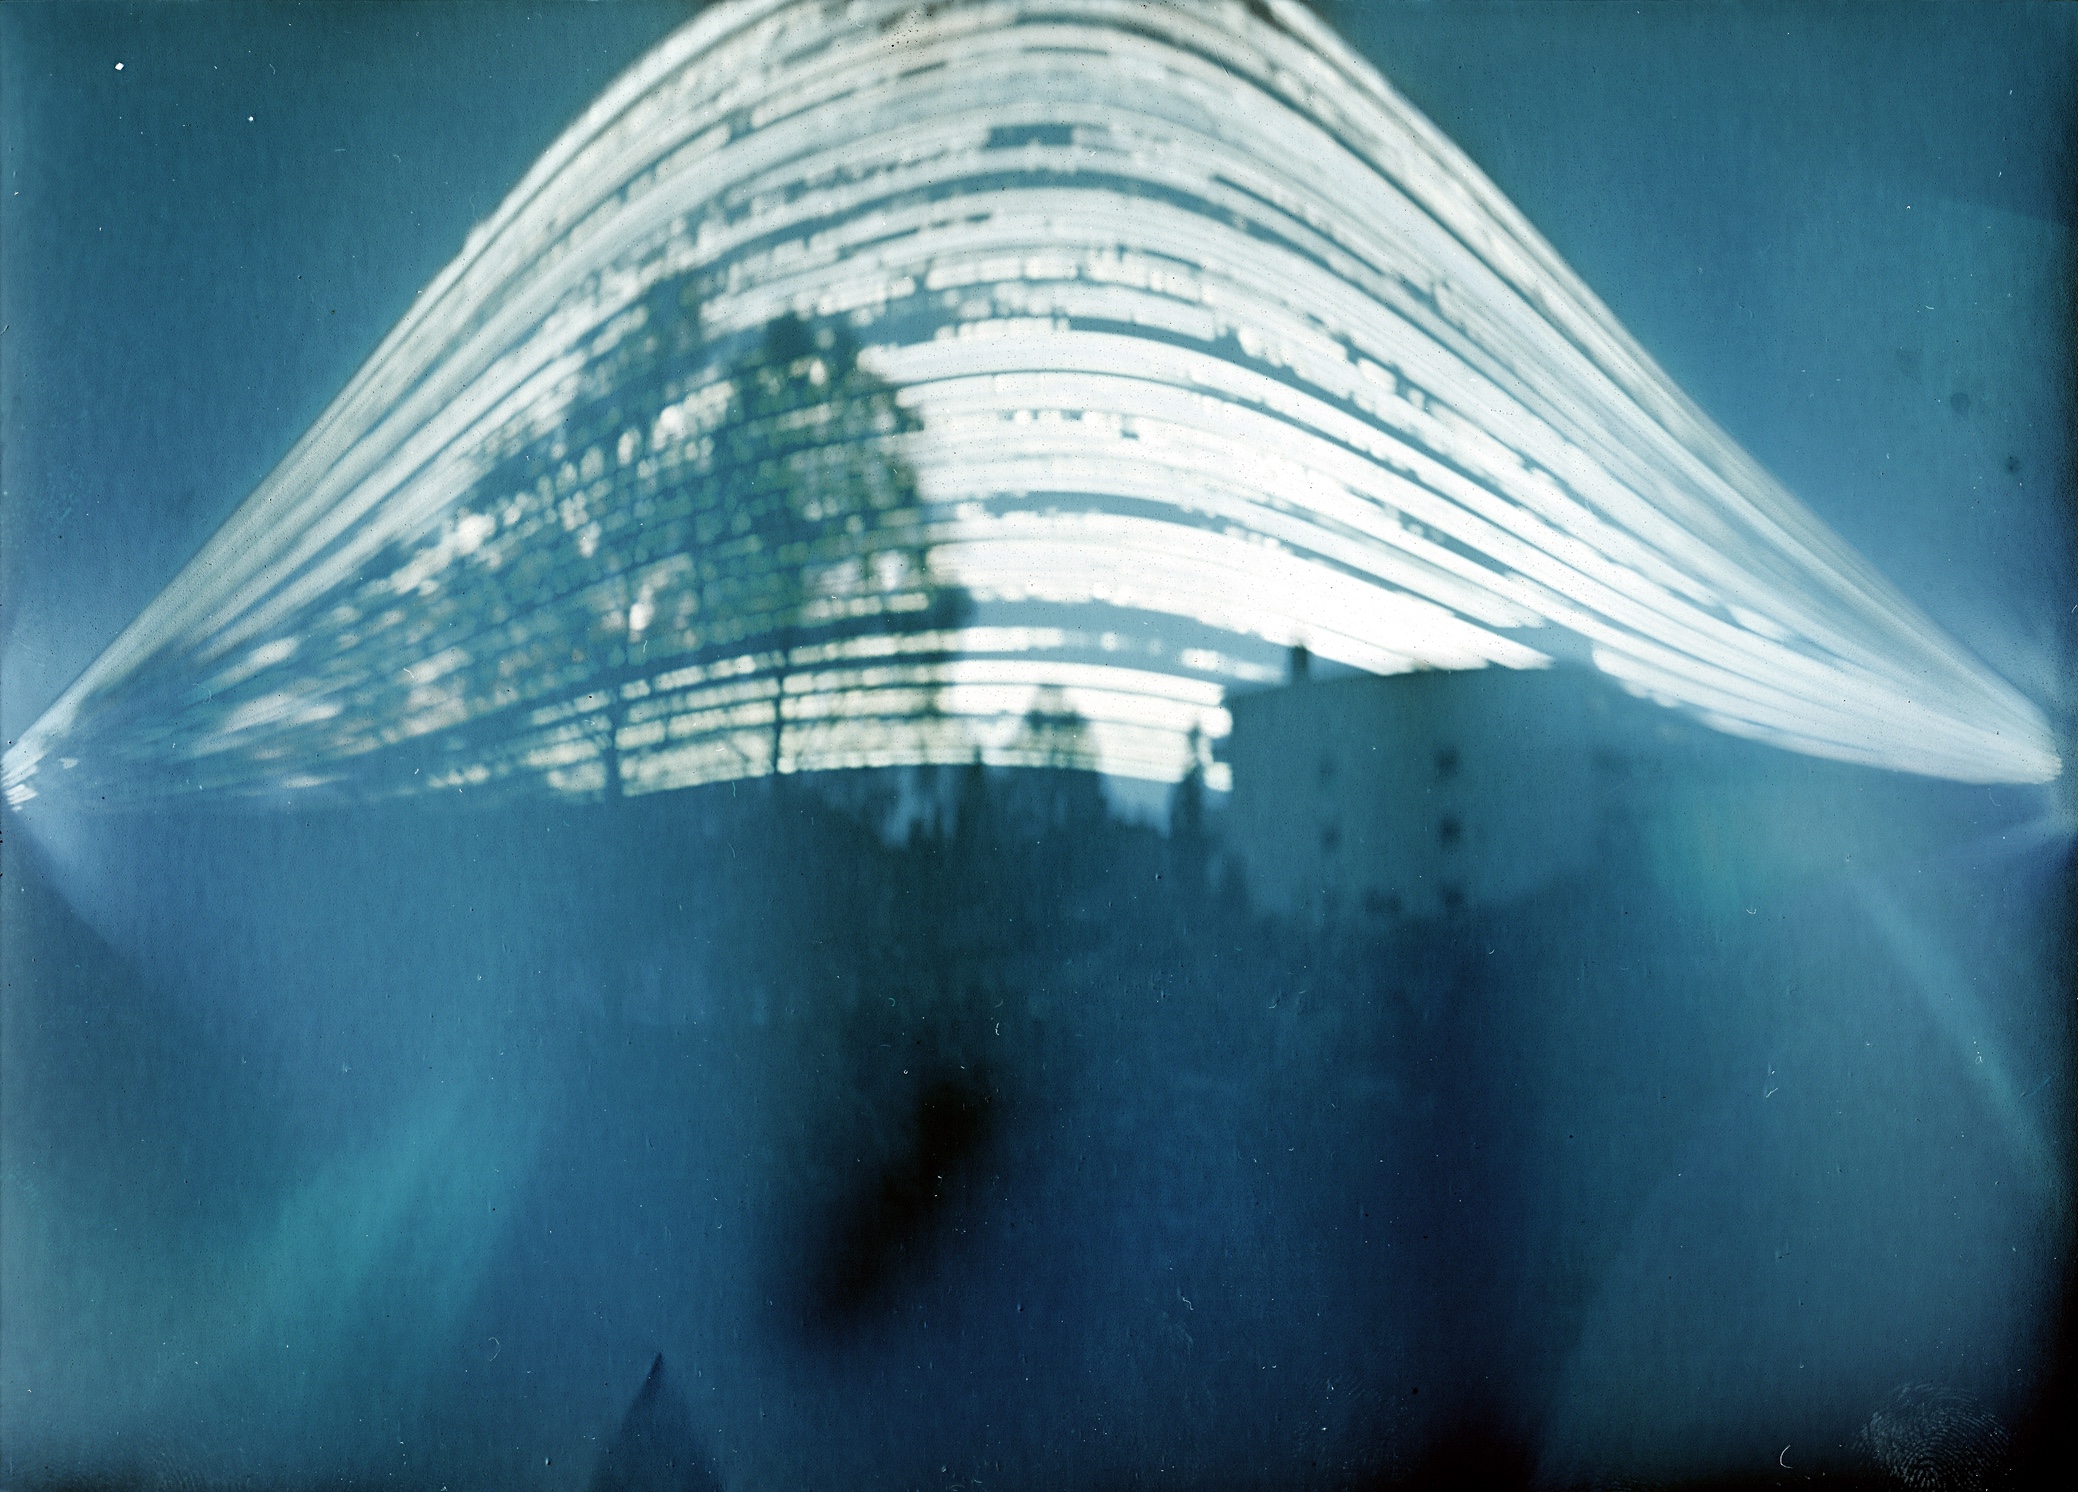
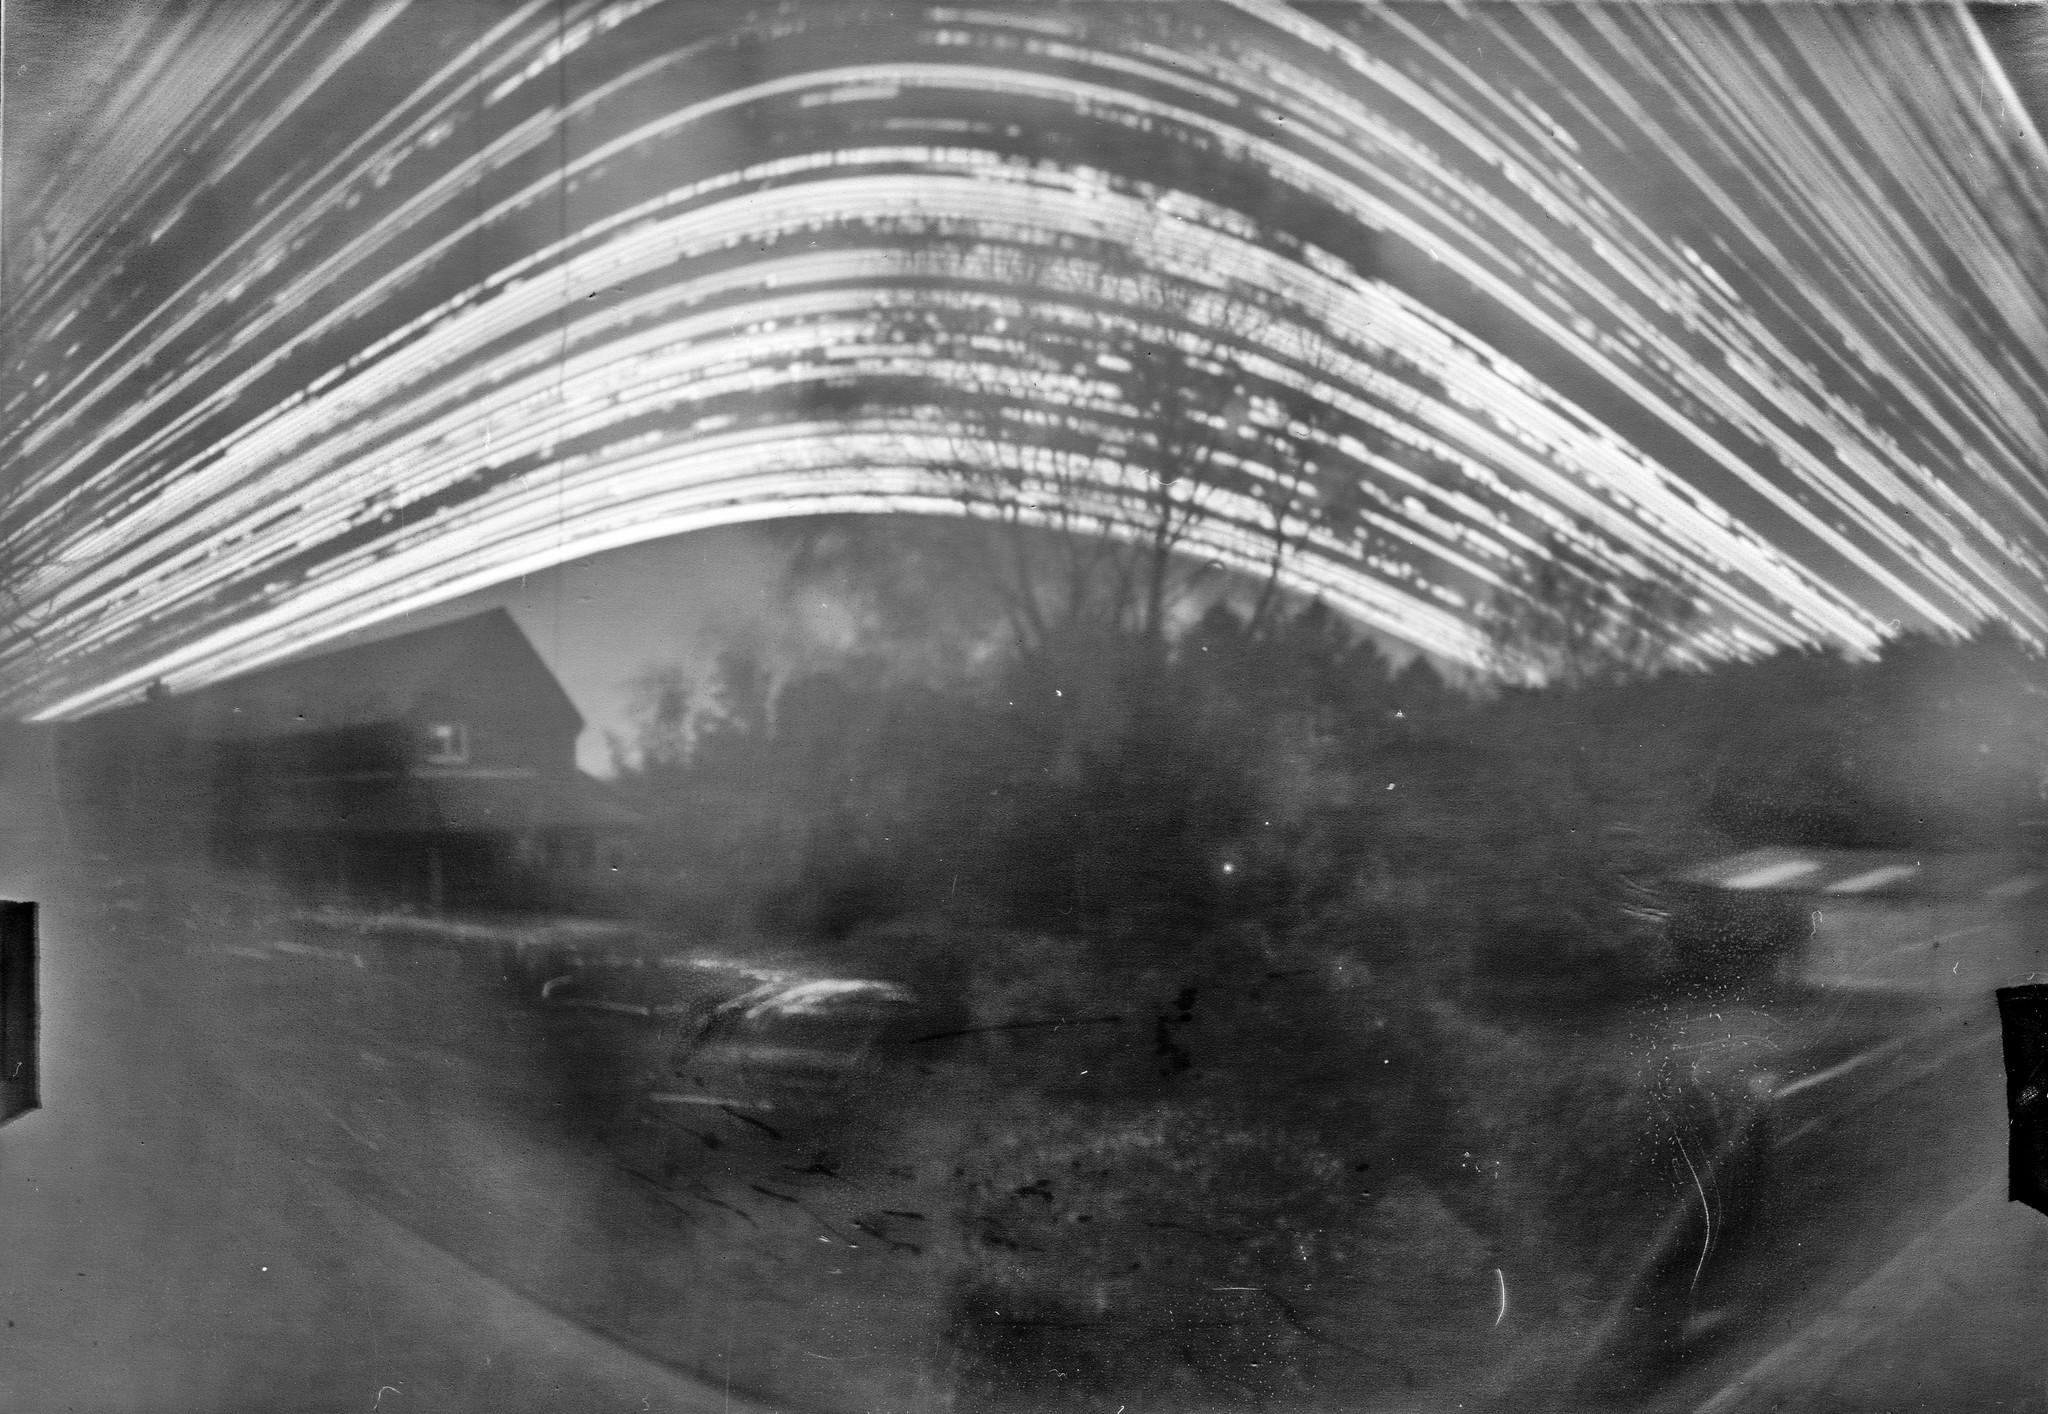
Each bright streak on a solargraph is one day's journey of the sun across the sky, from where it rose to where it set. The highest arc is the summer solstice, while the lowest is the winter solstice. Because the Earth's axis is tilted, the sun sweeps higher or lower through the sky as the planet moves around its orbit.
Where a streak breaks or goes missing, a cloud got in the way. A finished solargraph is also a recording of the weather over a time period. Not a very detailed one, but a recording nonetheless.
In his 2004 IEEE Visualization keynote, Pat Hanrahan discussed self-illustrating phenomena, a term he borrowed from Harry Robin: images produced by a phenomenon that expose the science behind it. The standard examples are physical, like iron filings arranging along magnetic field lines, sand collecting at the nodes of a vibrating plate (Chladni figures), particle tracks in a bubble chamber, etc. With the right apparatus, the phenomenon basically records itself.
Solargraphs are like that too, even though they're made for fun and aesthetics, not scientific curiosity.
Depicting the analemma
As the earth moves along its path over the course of the year, the position of the sun at the same time of day changes. It moves both vertically (the obvious change between the low sun in the winter and the much higher arc in the summer) and horizontally. When drawn as a diagram, this is known as an analemma.
This isn't usually something you can capture, since you'd have to take a picture at the same time every day over a year. That's why I love this very clever take on a solargraph, which shows just one (relatively) short exposure every hour, except they left the shutter open all day on the equinox.
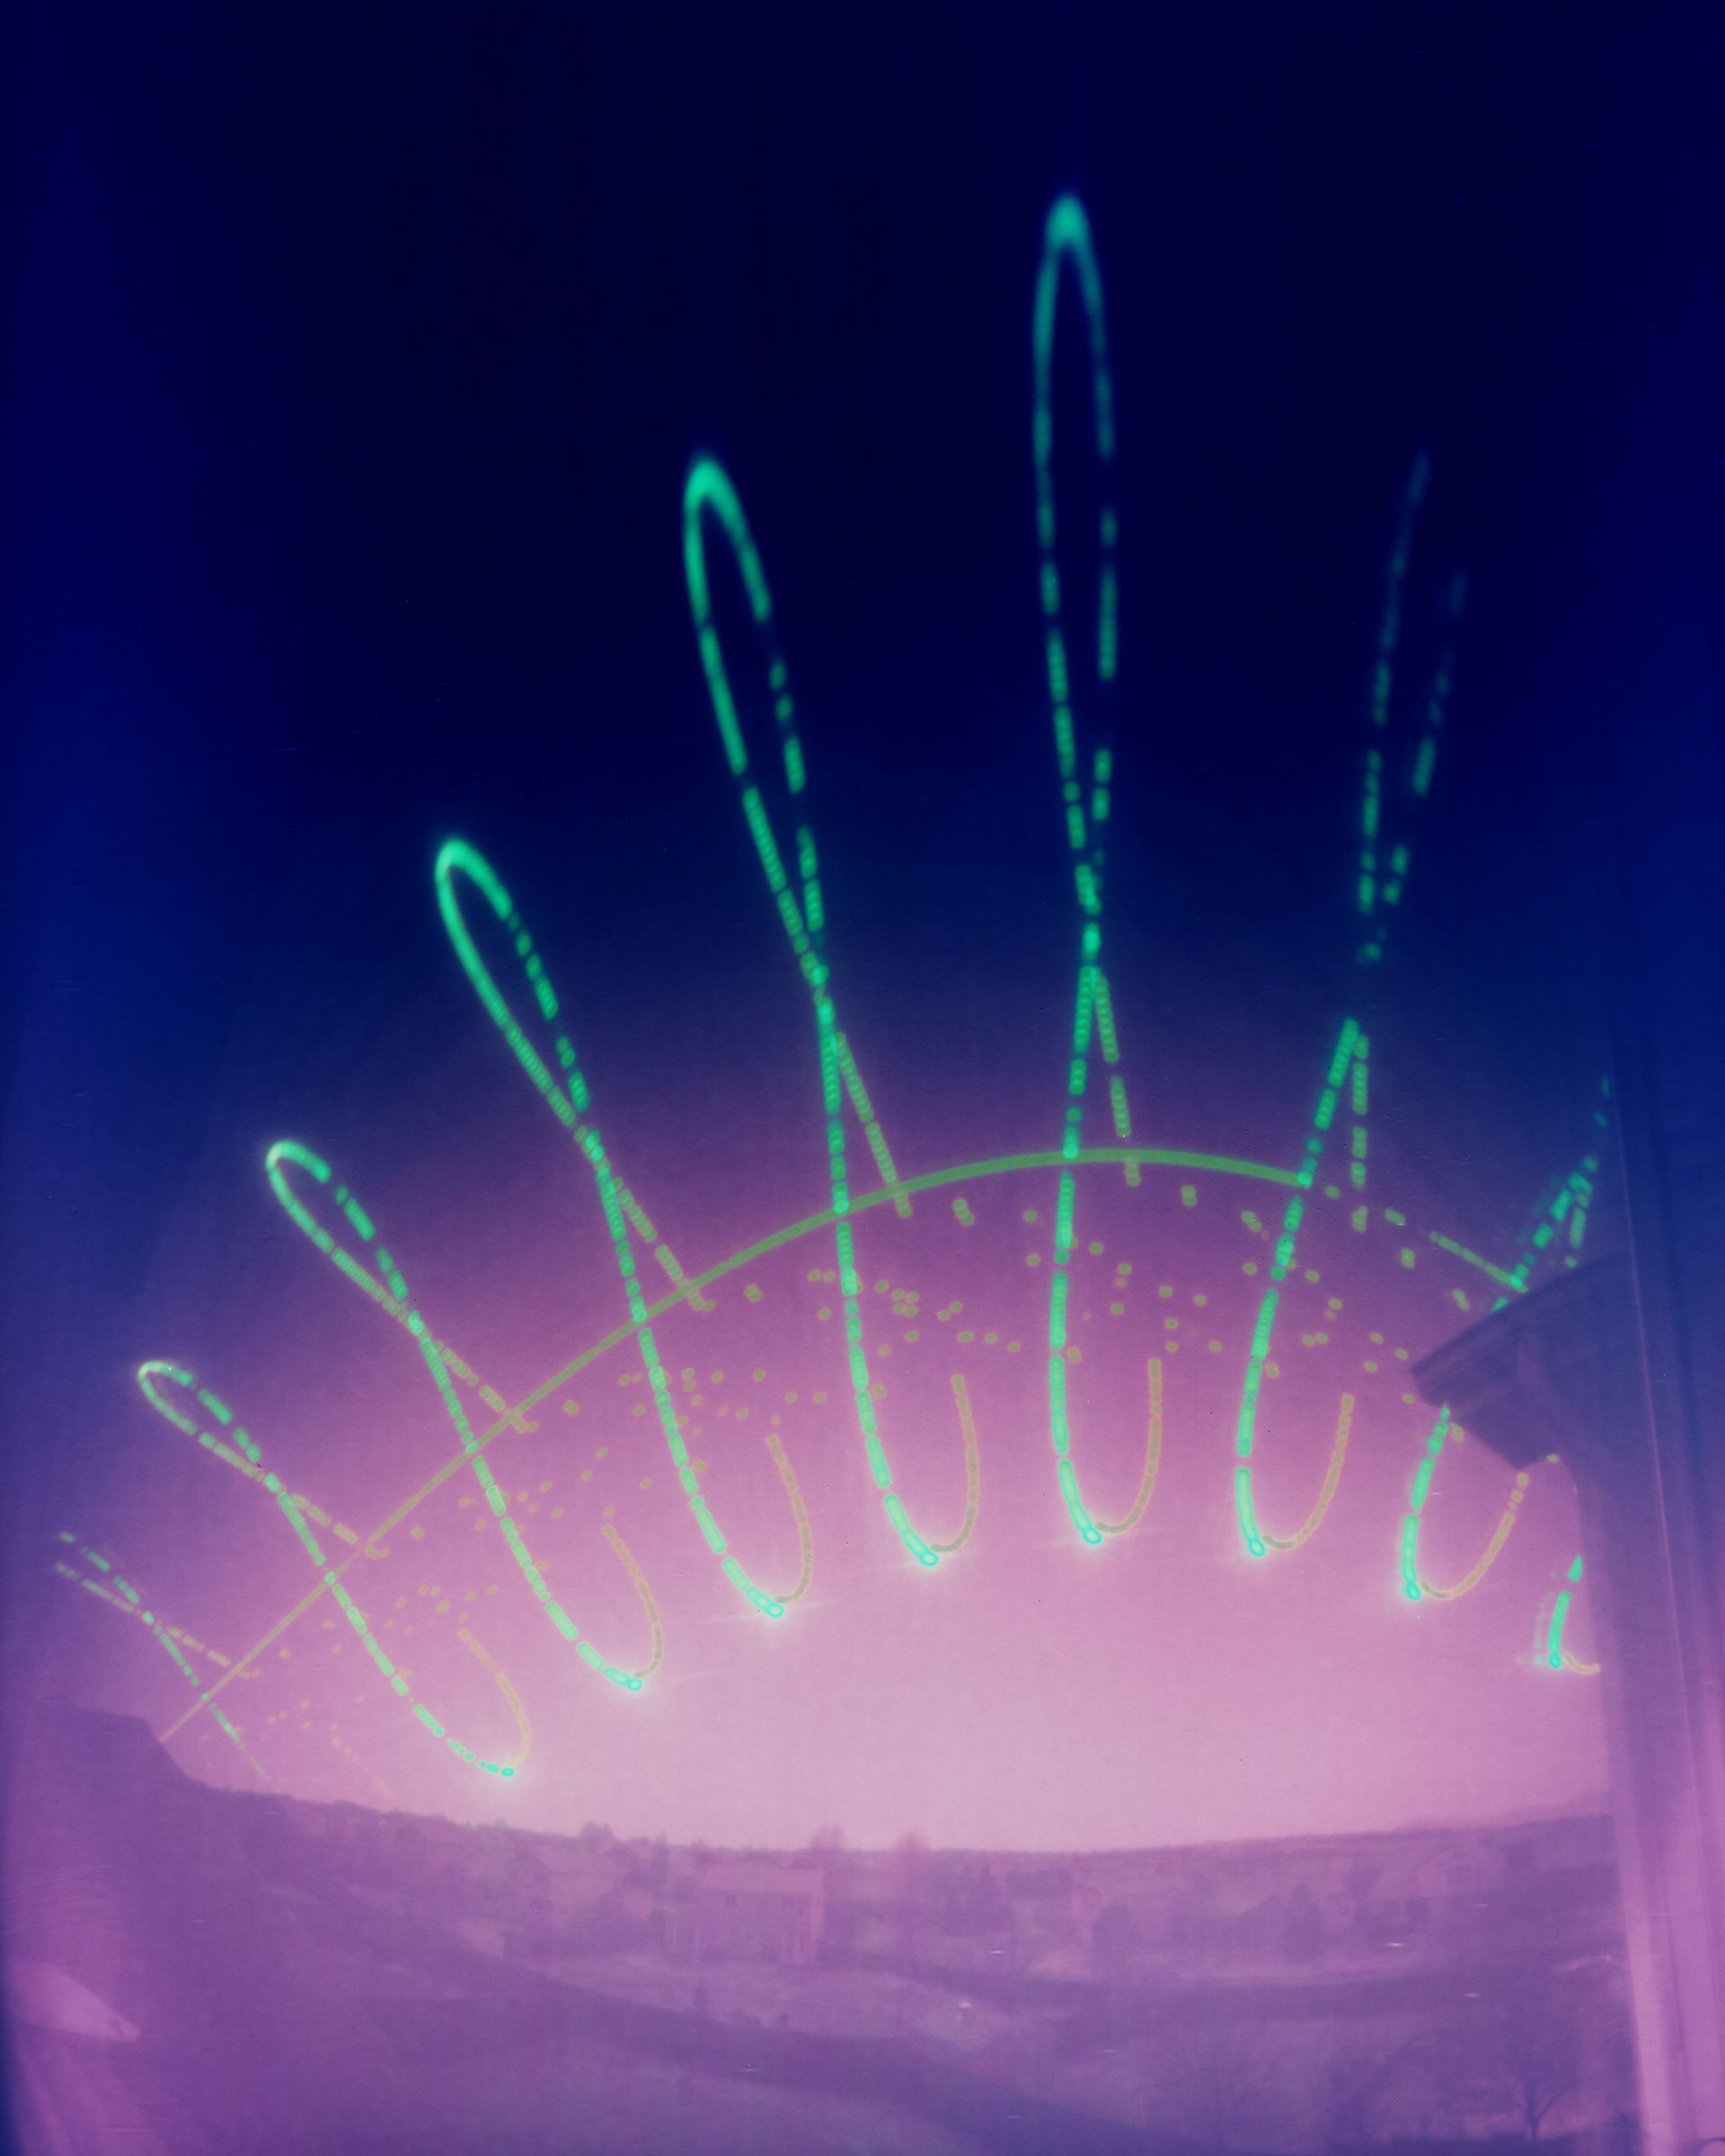
This is the most direct way of depicting the analemma, and I also love the psychedelic colors in this image.
Graphing the sun
Solargraphs are just what the name implies, they're drawn by the sun. With the simplest tools, it's possible to record a phenomenon that we're all familiar with at some level, but that we never get to see in one place like this. Solargraphs are incredibly simple, and yet deeply fascinating.
Leave a comment