A Better Definition of Chart Junk
Maximizing the data-ink ratio sounds like a good idea, but when actually followed to the letter produces terrible and nonsensical results. Here is a more reasonable definition of chart junk that does away with the pretense of a mathematical formula and puts some common sense back into the question of good chart design.
Much has been made of Tufte’s famous data-ink ratio, and many people like to rail, privately and online, against chart junk. In short, the data-ink-ratio defines the amount of information your chart elements (“ink”) are providing, with the goal of maximizing that ratio. Since we can assume that the information is constant, this means we need to minimize the amount of ink. Any ink on your chart that does not convey data is considered junk.
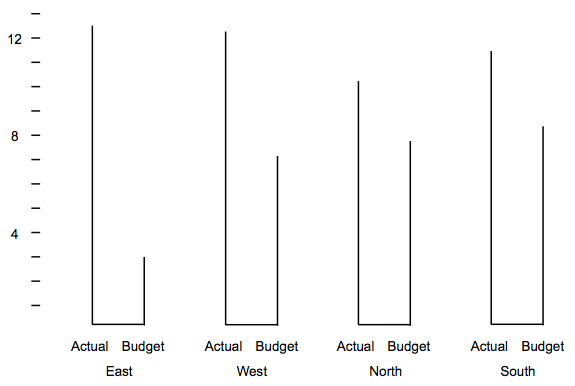
While this extremely reduced definition makes for great flame war fuel, it places the emphasis on the wrong question, and when property followed, leads to largely nonsensical charts (this example is from Stephen Few’s recreation of Tufte’s argument).
The first issue is the whole notion of ink. What does that even mean? If you live in a world of black ink on white paper, that may be a reasonable criterion. But add color and the whole thing breaks down. Color can be used well and can be terrible. Reducing ink does not tell us anything about that. The same is true for interactions like mouse-overs, sorting, and other conveniences our modern visualization machines afford us.
There is a parallel here with writing. While you might argue that using fewer and simpler words is generally preferable, nobody would argue that writing is merely a question of maximizing the information-to-letters ratio. Good writing needs clarity and simplicity just as it needs variation, voice, explanation, and many other things.
Which brings me to my alternative definition of chart junk:
Chart junk is any element of a chart that does not contribute to clarifying the intended message.
Do you have more bars than necessary? Get rid of them! Are you missing context that would help people understand the values better? Add it in! Is your use of color distracting from the message? Change it! Are people not able to figure out what you are telling them? Use highlights!
Do you see the difference? Instead of minimization at all cost, we are now asking questions about the purpose of this thing you are creating. We are no longer pretending that visualization design is a mathematical optimization, and instead thinking about what we want to achieve.
Chart junk is still chart junk. Don’t add meaningless nonsense to your charts! Don’t clutter them up! Reduce the impact of grid lines, etc. But also think about how you can clarify the message, how you want people to read your data, and what you want them to take away. Perhaps adding things will actually help. What was considered chart junk before might turn out to be useful.
Comments (14)
Posting new comments was disabled in 2020.