• Skip to main content
  • Skip to primary sidebar
  • Skip to footer

eagereyes

Visualization and Visual Communication

  • Explore
    • Starter Pack
    • Blog Calendar
    • Blogroll
    • eagereyesTV YouTube Videos
  • Practical
    • Basics
    • Pie Charts
    • Techniques
    • Book Reviews
    • Journalism
  • Academic
    • Speaking Mistakes
    • Acceptance Rates
    • Papers
    • Conference Reports
    • Lists of Influences
    • Criticism
    • Peer Review
  • Admin
    • About
    • Contact
    • License
The Winding Path of Data Analysis

Robert Kosara / October 3, 2016

The Winding Path of Data Analysis

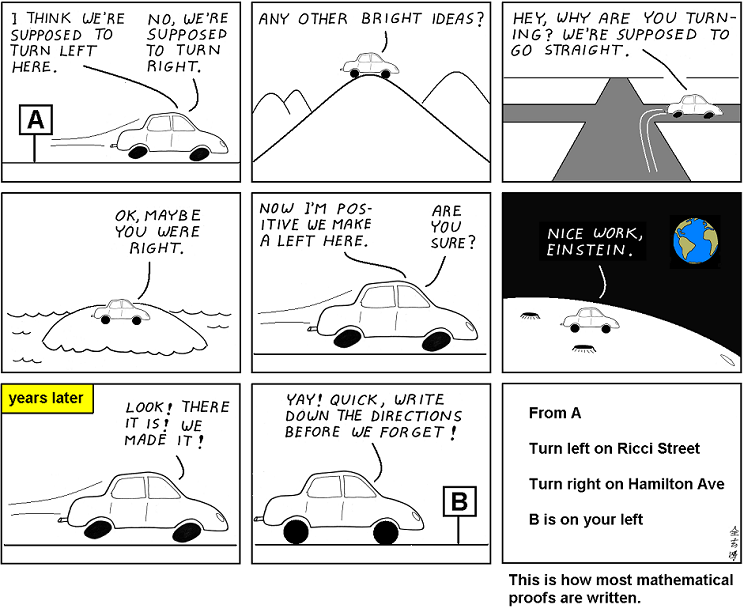
Data analysis is not a straight-forward process: you try out lots of things, you go down a path that seems promising but then turns out to not work out, and suddenly you hit upon the thing you were looking for.

This comic is about mathematical proofs, but what hit me recently is how well it also applies to data analysis.
it_is_obvious

It’s not just the many false starts, it also nicely shows the difference between analysis and presentation: analysis is where you make all the mistakes, but nobody cares about those. When you present your results or your insights, you show the logical, straight path. You want to present a sequence of steps that make sense, no matter whether you actually followed them during your analysis or not.

The human element here is still remarkable, and it makes me very skeptical about automated approaches. A machine might be able to try out lots of things, but how is it going to know which ones are meaningful? How is it going to tell a coherent story about its findings?

And while I get the idea of preregistration for studies, I’m not convinced that they’re feasible for the same reason. There’s just too much work that goes into the data analysis that is not mechanical, even without p-hacking.


Filed Under: Blog 2016

Robert Kosara is Data Visualization Developer at Observable. Before that, he was Research Scientist at Tableau Software (2012–2022) and Associate Professor of Computer Science (2005–2012). His research focus is the communication of data using visualization. In addition to blogging, Robert also runs and tweets. Read More…

Reader Interactions

Comments

  1. Bhushan Karle says

    October 4, 2016 at 2:52 am

    Great insight.

    Reply
  2. mjskay says

    October 4, 2016 at 8:09 am

    While it doesn’t work for every situation (e.g. certain kinds of observational data, existing datasets), pilot studies can help address the difficulty with pre-registration you have identified. Run a pilot, follow the winding path of data analysis (I like this analogy!), record your path (e.g., as an R script). Then run the final study and use the same analysis on it. This can also help in other ways: e.g., if you want to do a power analysis, your pilot gives you the data to do that, which helps you choose the sample size for the full study.

    Of course in practice—limited resources, limited time—it can be hard to do this. In the case where you already have the data, I think another useful approach is model averaging—follow your winding path, but acknowledge your uncertainty in choosing the correct path (model) by averaging over several paths (models) you found.

    (I think the analogy might break down at this point…)

    Reply
  3. Jerzy says

    October 6, 2016 at 6:46 pm

    I love this comic. And I agree that there are serious concerns about “rote” data analysis getting the right p-values but missing out on insights. (William Cleveland’s books have some great examples.)

    But most of all, thanks for that “preregistration controversy” link, and its link to Cortex and other journals’ “Registered Reports.” These seem like a great additional publication option that addresses some of the concerns around preregistration.

    I understand the worry that preregistered “rote” data analysis would prevent you from reporting extra, unexpected findings. But apparently for journals like Cortex, it’s no problem—just report them in a separate “post hoc” section (as long as your main question+study was interesting and well-designed). If anything, those post-hoc things are fodder you can use to preregister your next study and thus expand your CV, *whether or not* they pan out next time.

    Plus, it’s optional. Nobody’s being banned from publishing their usual studies. It just means there are *also* places which reward good study design and ignore p-hacking.

    @mjskay: Amen to pilot studies!

    @Robert: Did you mean preregistration is rarely/never feasible? Or it can be feasible, but just shouldn’t be a blanket requirement?

    Reply

Leave a Reply to Bhushan Karle Cancel reply

This site uses Akismet to reduce spam. Learn how your comment data is processed.

Primary Sidebar

More Blog 2016 Articles

  • A Roundup of Year-End News Graphics Roundups
  • The Dumbest User Interface of 2016
  • When Rankings Are Just Data Porn
  • The EagerEyes Holiday Shopping Guide
  • The Problem with Vis Taxonomies

Recently Popular

  • Data: Continuous vs. Categorical
  • Midjourney is a Trip
  • The Simple Way to Scrape an HTML Table: Google Docs
  • Watch My Outlier Talk: This Should Have Been A Bar Chart!
  • New video: Gauges for Data Visualization, The NY Times Election Needle, and Circular Bar Charts
  • Continuous Values and Baselines
  • Paper: More Than Meets the Eye: A Closer Look at Encodings in Visualization
  • Facebook
  • GitHub
  • LinkedIn
  • RSS
  • Twitter
  • YouTube

Subscribe via Email

Footer

  • About
  • Contact
  • License

Copyright © 2006–2022 Robert Kosara · All original materials are available under CC-BY-SA


Loading Comments...