Conference Acceptance Rates
Acceptance rates are one of the key ways of measuring the quality of conferences. I think it's time we collect that data for conferences relevant to visualization. I have put together a page for this, and have found some of that data. But I need your help to fill in the gaps and suggest other conferences that would be of interest.
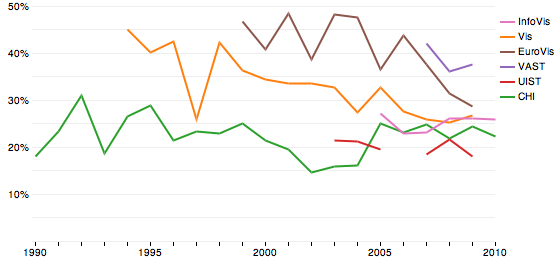
I originally only wanted to include the VisWeek conferences, but then I figured it would make sense to extend the list a little bit. So currently, there is InfoVis, Vis, VAST, EuroVis, AVI, UIST, and CHI. I am open to suggestions for further conferences to include, but I want to keep focusing on visualization. So even though CHI and UIST are included, I don't want to expand into HCI much more.
There is also missing data. Especially for InfoVis, IEEE Xplore doesn't have the prefaces for conferences before 2005. Some of the early Vis conferences and a few others are also missing. Please take a look at the list and if you have access to proceedings for years where numbers are missing, send them to me or leave a comment below.
Given that this is about visualization conferences, I figured it would make sense to also visualize the data. The first visualization shows acceptance rates from 1990 to 2010. Not all of the missing lines are actually missing data, because the different conferences started at different times.
The next task is to look into impact factors for visualization journals. That information seems to be much harder to come by though, unfortunately. But it would be very worthwhile.
Follow this link to the acceptance rates data. The data is also available in CSV and JSON formats in a repository on github.
Posted by Robert Kosara on June 6, 2010.